2 layers60 × 40 mm
Trace sample
mteichtahl/trace
trace runs a repository by itself and gives Claude the tools to do electronics work in it. It is generalised from the loop that runs Potroller.
17 parts
 mteichtahl/trace
trace runs a repository by itself and gives Claude the tools to do electronics work in it. It is generalised from the loop that runs Potroller.
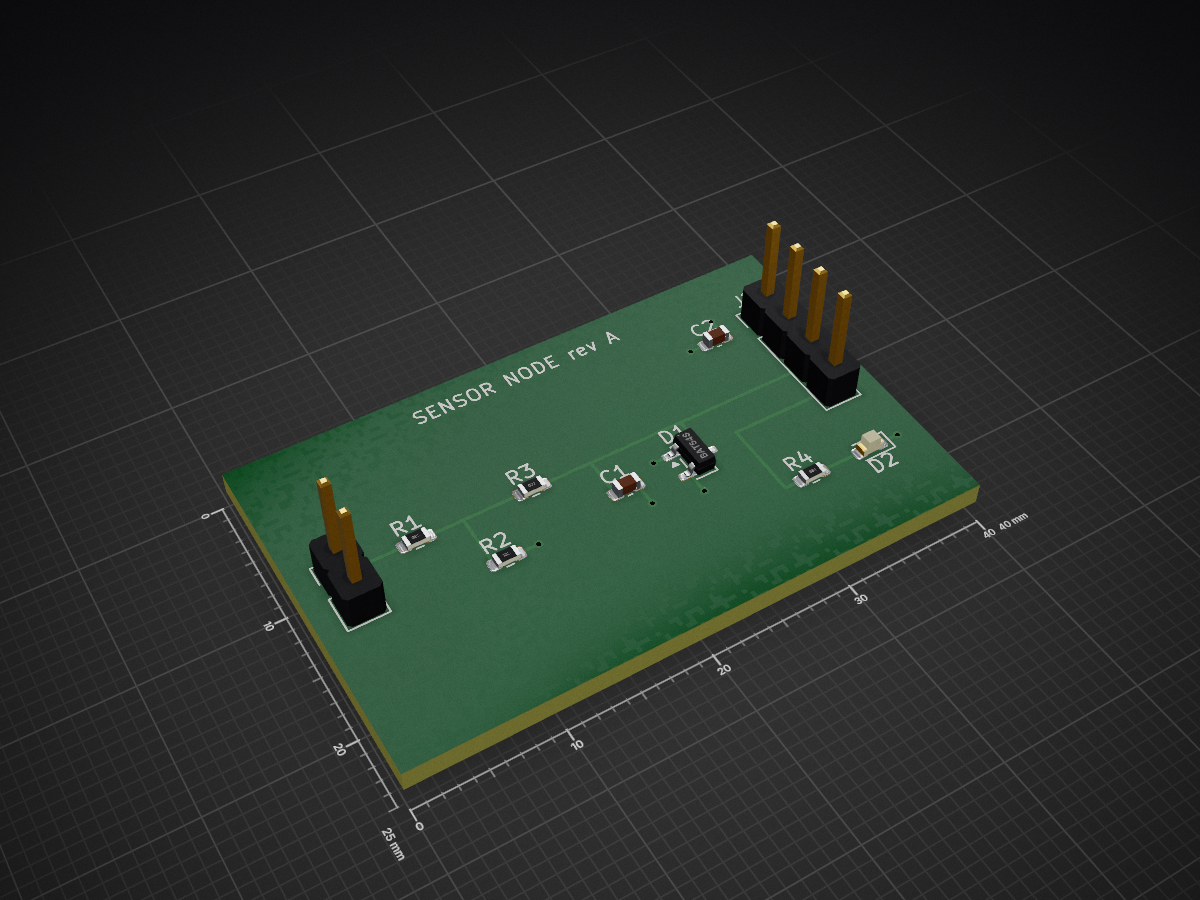
Sensor node is an open-source printed circuit board by mteichtahl, from the mteichtahl/trace repository on GitHub. It is a 2-layer board of 40 × 25 mm with 10 parts on 7 nets, routed with 23 tracks and 7 vias.
It is built around the CC0603KRX7R9BB104, BAT54S-7-F-79 and PZ254V-11-04P, with the KT-0603R and PZ254V-11-02P among its other parts. Its parts include 4 resistors, 2 capacitors, 2 diodes and 2 connectors. It belongs with the home automation and IoT and sensors and measurement boards of this library.


trace runs a repository by itself and gives Claude the tools to do electronics work in it. It is generalised from the loop that runs Potroller.
tracectl CLI and, for Claude Code, from the trace MCP server.npm install -g github:mteichtahl/trace#main # the `tracectl` CLI (Node 22.13+; git, which this needs anyway)
tracectl install # opens the installer in your browserThe command is tracectl, not trace: macOS ships its own /usr/bin/trace (kernel tracing), and a trace on
PATH would shadow it, or be shadowed by it wherever nvm's directory is not first (sudo, cron, launchd). The
product, the MCP server (claude mcp add trace -- tracectl mcp) and .trace/ keep the name.
What you need: AWS credentials (a profile, SSO included, or access keys; an administrator is simplest) and one
GitHub token. Nothing else: no Docker, no gh CLI, no KiCad or Python on this machine (the images build in
CodeBuild, and onboarding talks to GitHub's API and git).
The token: a fine-grained token (github.com/settings/personal-access-tokens) on the repositories trace will run, with
Contents, Pull requests, Issues, Workflows, Actions, Secrets, Variables, Administration and Webhooks read and write,
Deployments read, and the account permission "Email addresses: read"; or a classic token with repo, workflow and user:email. What each
permission is for, and what happens without it, is in Tokens and permissions.
Builds need nothing more. Every GitHub Actions job runs on an AWS CodeBuild runner in your account, trace's own repository's included, and on GitHub's runners only until that runner exists. CodeBuild reaches GitHub through an AWS CodeConnections connection already authorized in the account and region when there is one, else through that same token (see Where builds run), so the first deploy has the runners and no console step is needed.
The installer is a page served from your own machine (127.0.0.1, with a one-time key in its address). It has four steps, and only the first asks for anything:
src/installer/preflight.ts); where the installer can fix it itself
it offers a button, and does nothing until you press it.Worked out, not asked (src/installer/derive.ts):
| Setting | From |
|---|---|
| Account | STS GetCallerIdentity (a second run stops if the credentials now resolve to another account) |
| Region | The profile's region, else us-east-1 (Advanced to change) |
| GitHub login | The token (GET /user) |
| First administrator | The token's verified primary email (GET /user/emails); asked for under Advanced only when the token cannot see it |
| Model | The newest Claude Sonnet inference profile active in the region, the region's geography before global. |
| GPU and CPU jobs | On when the account's quotas allow one job (G and VT instances for GPU, standard instances for CPU), else off |
| Knowledge bases | On where the region has Amazon S3 Vectors |
| Prefix, session limits, bucket, observability, images | Their defaults (trace, 8 h, 15 min, a named bucket, on, prebuilt) |
| How the build runners reach GitHub | An authorized GitHub connection in the account and region, else the token (Where builds run) |
| Web app | On, at CloudFront's own address; a custom domain and email sign-in codes are optional (Web app) |
The preflight checks, in parallel: the credentials; Bedrock AgentCore in the region; the model's inference
profile and the account's access to it (GetFoundationModelAvailability; for Anthropic, whether the one-time use-case
form was sent, GetUseCaseForModelAccess); Amazon S3 Vectors; the G and VT and standard-instance quotas (Service
Quotas) and the region's VPC quota; the CDK bootstrap (present, healthy, version 6 or later); the trace stack (none,
updatable, or stuck after a failed first deploy); names a removed installation kept (its image repositories and token
secret) that a new stack would collide with; the Cognito domain <prefix>-<account>; how the build runners will reach GitHub (an authorized GitHub connection, or
CodeBuild's GitHub credential, which with the token must be allowed to make each repository's webhook);
the token, its email, and whether trace's own actions can be used from other repositories; and, per chosen
repository, exactly which permission is missing and what that costs. What it offers to do:
| Finding | What the installer can do (on request) |
|---|---|
| Anthropic's first-time-use form not sent | Send it (PutUseCaseForModelAccess) with your answers; once per account or organisation |
| No access to the model yet | Accept its agreement (ListFoundationModelAgreementOffers, CreateFoundationModelAgreement; needs aws-marketplace:Subscribe and a payment method) |
| G and VT quota below one job (4 vCPUs) | Leave GPU and CPU jobs off and request 16 vCPUs (RequestServiceQuotaIncrease); turn them on and run again once granted |
| Standard-instance quota below one CPU job, or the region's VPCs full | Request an increase |
The stack is ROLLBACK_COMPLETE (a failed first deploy) | Delete it, so the next install can create it |
| A removed installation's image repositories and token secret | Delete them |
| trace's actions not shared (a private source repository) | Share them with repositories of the same owner, when the token is its admin |
Model access never blocks installing: the stack deploys without it, and the agents work once it is granted.
It then runs the plan:
agent/README.md), cad function (the same image on
a role with no S3, where the project's case script runs; see Enclosures) and CodeBuild build runner (see Where builds run), and the API runtime. Each project's
resources are in a nested stack of their own (see Stack layout). A project's worker is
invoked by that repository's workflows through IAM, and by the API. The API runtime is for people and is reached
only with a Cognito sign-in. The stack also holds the Cognito user pool. Before the deploy, the token becomes
CodeBuild's GitHub source credential when the runners use it; after it, only when the runners wait for a GitHub
connection nobody has authorized yet, the installer waits for that and deploys again with them.<prefix>/integrations/<name>.TRACE_AWS_ROLE,
TRACE_AGENT_RUNTIME_ARN, TRACE_MEMORY_ID, TRACE_KB_ID, TRACE_KB_DATA_SOURCE_ID and TRACE_CODEBUILD_PROJECT,
all its own project's, TRACE_AWS_REGION, TRACE_HOME, TRACE_AGENT_LOGIN) and its TRACE_TOKEN secret (its
project's agent token, encrypted with the repository's key); and its onboarding pull request, or, when it is onboarded already and the trace workflows
have changed, a held pull request refreshing them (src/installer/onboard-api.ts). trace's own repository gets
TRACE_CODEBUILD_PROJECT alone, and TRACE_UPDATE_ROLE, TRACE_AWS_REGION and TRACE_STACK so the installation
keeps itself up to date (see Staying up to date). TRACE_CODEBUILD_PROJECT is set only once
the repository's build runner exists.tracectl login). Only then does it wait for the GPU image: the
deploy starts it and does not wait for it (see GPU jobs), and it starts it
again if an earlier one failed. A failed GPU image leaves GPU and CPU jobs unavailable and everything else
installed.How long (estimates from what each step does; not yet measured on a real account):
| First install | Re-run or upgrade | |
|---|---|---|
| CDK bootstrap | about 2 minutes, when the region has none | none |
| The stack | about 15 minutes of CloudFormation, plus the agent image: about 5 minutes to copy a published one, 20–40 to build it | a few minutes for settings or projects; 5–10 when trace changed (the image rebuilds from its cache, or is copied) |
| Repositories, runners, onboarding, people | 1–2 minutes, in parallel | the same |
| GPU image (after trace is ready) | about 10 minutes to copy, 30–60 to build | from its cache |
Before this change the first install was the bootstrap, then 20–40 minutes for the agent image inside the deploy, then each repository and person one after another, and only then the 30–60 minute GPU image before the page said anything was done: about 60–110 minutes to a usable trace on a GPU-enabled account. Now it is about 20–25 minutes with a published image (35–60 when it builds), and the GPU image no longer stands in the way.
Running it again updates the installation: the preflight says so, the plan lists what changes since the last run from this machine (projects added or removed, settings changed, people), and CloudFormation leaves the rest alone. Every step is safe to repeat. Adding or removing a repository adds or removes that project's runtime, roles, secret, job definitions and runner.
Tokens and keys stay in the installer's memory. They are written only to Secrets Manager, to GitHub (encrypted), and, when the build runners use the token, as CodeBuild's GitHub source credential (see Where builds run).
Install the sample project, on the Projects step, adds a new repository (<your login>/trace-sample unless you
name another): a small, finished sensor board from intent to fabrication files (templates/sample). It is the
quickest way to see the whole system work before you bring your own design, and it can be the only project.
main, with no pull request to merge.
Its journey starts too, as a project made in the web app does: the Mixed template, at Define, so the web app shows
its stages and gates from the start.tracectl hil emulate).
The tasks that need GPU or CPU jobs wait for the GPU image (and are left out when GPU jobs are off). The tour runs
on AWS like any other work and costs what that work costs; untick Start the tour to install the sample without
it. Running the installer again opens only the tasks that are missing.test/installer/sample-tour.test.ts keeps the tour complete: a tool, agent or kind of remote job added without a
tour task fails it.
One token does everything. On each repository it needs:
| Permission (fine-grained) | For | Without it |
|---|---|---|
| Contents, Pull requests, Issues, Workflows, Actions: read and write | The agents' work, the onboarding PR | Onboarding fails for that repository |
| Secrets, Variables: read and write | Its TRACE_TOKEN secret and variables | Refused for that repository, unless an admin token is given |
| Administration: read and write | Its settings and the "trace" ruleset; with the token as CodeBuild's credential, CodeBuild registering each job's runner | Settings and ruleset left alone; with the token as CodeBuild's credential the preflight stops: its runner can't be made |
| Webhooks, Commit statuses: read and write | With the token as CodeBuild's credential, its runner's workflow-job webhook; and the web app's live updates from GitHub | The same (a GitHub connection needs neither); live updates are a warning, and its screens look again every 60 s |
| Deployments: read | The project's last deploy in its status (the app and chat) | Its status says the last deploy is unreadable; the rest still shows |
| Email addresses: read (account) | The first administrator's email | The email is asked for |
A classic token needs repo, workflow and user:email, and its account must be an admin of each repository. The
preflight probes each permission without changing anything and names the missing ones per repository.
The optional second token (Advanced → Admin token): when the agents' token is deliberately narrow (no Secrets, Variables or Administration, which the agents never need), give an admin token for the installation; it is used only while installing and never stored, unless you choose it as the token CodeBuild keeps (Advanced → Build runners). A project's own agent token (Advanced) isolates that project's agent on GitHub, as Project isolation explains.
trace's GitHub app (its own rate limit). The workflows' harness steps (open-pr, automerge, update-queue,
ci-doctor) act as trace's GitHub app when it is installed on the repository: each job gets an installation token for
that repository alone, good for an hour, with the app's own quota (5,000 requests an hour and more, per installation).
Without it they spend the quota of the person whose token TRACE_TOKEN is, which ten open pull requests and busy agents
used up in an hour (test-esp32 run 2, #126). The app's private key is never a repository secret: it is kept in Secrets
Manager (<prefix>/github-app), and only the installation's token broker reads it (<prefix>-github-app-token, a
Lambda function URL with IAM sign-in, docs/agent-identity.md). The broker picks the repository
from the AWS role that asks, never from the request. What each project repository needs for it:
| What | Where | For |
|---|---|---|
| The broker's address | Variable TRACE_GITHUB_APP_BROKER | Where the steps ask for the app's token |
| The repository's token role | Variable TRACE_GITHUB_APP_ROLE | Assumed by GitHub OIDC from any of the repository's workflow runs (branches and pull requests too: open-pr and automerge run there, and the default-branch role TRACE_AWS_ROLE cannot be assumed there); it may do nothing but ask the broker |
| The app installed on the repository | The app's installation | Its token; not installed: TRACE_TOKEN, with a notice |
| Contents, Pull requests, Issues, Actions: read and write; Checks, Metadata: read | The app's permissions | What the steps do; a request the app is refused is made with TRACE_TOKEN instead, with a warning naming it |
Still TRACE_TOKEN's: opening a pull request (trace tells its changes apart by the login that opened them,
TRACE_AGENT_LOGIN), pushes made with git (not API requests, so no quota), and a step without the broker (no variables,
a role that could not be assumed, a broker that refuses or does not answer: the step's log says which). The app needs no
workflows permission: a branch update that changes .github/workflows/** falls back to TRACE_TOKEN. The agents'
own steps (Claude's pushes and comments) keep TRACE_TOKEN for now (src/harness/app-token.ts).
Nothing on the default path needs the AWS console. The preflight's fixes are API calls (the Anthropic use-case form,
PutUseCaseForModelAccess; the model agreement, CreateFoundationModelAgreement; quota increases,
RequestServiceQuotaIncrease; a failed first deploy, DeleteStack; a stuck rollback, ContinueUpdateRollback; a
removed installation's sign-in domain, DeleteUserPoolDomain; its kept repositories and secret), the build runners
use the token unless a connection is authorized already, and publishing images is set up by API too. What a person
still decides, and why:
| What | Why it can't be automated | When it comes up |
|---|---|---|
| Authorizing a new AWS CodeConnections connection | AWS requires the GitHub app's installation to be approved in the console (the OAuth handshake with GitHub) | Only with Advanced → Build runners → "An AWS CodeConnections connection" and none authorized yet |
| Waiting for AWS: a pending Anthropic agreement, a quota increase | AWS decides (it emails; usually minutes for the agreement, within a day for a quota) | Only when the preflight found them missing; installing never waits |
| A payment method on the account | The model agreement is an AWS Marketplace subscription, which needs one (Billing) | Only on an account that has none |
| A custom ECR Public alias | Requested in the console only | Never: trace uses the registry's default alias |
| Sharing a private trace source repository's actions | GitHub requires that repository's admin | Only when you are not its admin |
Keys for external services some tools use. None is needed to install or deploy; without one, the tools that use it
carry on with what they have and say which key would add more ("no Nexar (Octopart) credentials …: add them with
tracectl integrations set nexar").
| Integration | Keys | Enables | Get one |
|---|---|---|---|
nexar | NEXAR_CLIENT_ID, NEXAR_CLIENT_SECRET | Stock, prices and lifecycle from every distributor Octopart lists (parts lookup, search, alternatives, BOM checks) | portal.nexar.com |
mouser | MOUSER_API_KEY | Mouser stock, prices, lifecycle, datasheet links | mouser.com/api-hub |
digikey | DIGIKEY_CLIENT_ID, DIGIKEY_CLIENT_SECRET | Digi-Key stock, prices, lifecycle, datasheet links | developer.digikey.com |
dhl | DHL_API_KEY | Following a shipped order's DHL parcel (Cost and orders); read by the order watch only, kept as <prefix>/order-watch/dhl, never by a worker | developer.dhl.com |
LCSC needs no key, and the datasheet tools fetch public URLs; those are every credential the tools read
(src/core/integrations-catalog.ts, checked by test/core/integrations.test.ts).
tracectl integrations list                      # which are set, what each enables
tracectl integrations set nexar                 # asks for the keys (or NEXAR_CLIENT_ID=… NEXAR_CLIENT_SECRET=…)
tracectl integrations check nexar               # the stored keys, checked with Nexar
tracectl integrations remove nexar
tracectl integrations set mouser --remote       # through the API, as a signed-in admin
Each is one Secrets Manager secret, <prefix>/integrations/<name>, written by the installer, the CLI (your AWS
credentials) or an admin through the API (integrations.set, .list, .remove; the API may write them and never
reads them back). A key is checked with its service when given; a failed check is reported and the key stored anyway.
With the library gateway off, each worker role may read <prefix>/integrations/*, and the worker loads them into its
environment when it starts (so an agent, which has Bash and its role's credentials, can read them too). With the
library gateway on, only the gateway's Lambda may read them and no worker role can. A changed key
reaches workers at their next session and the Lambda at its next cold start; nothing is redeployed.
The three images (the agent's, arm64, at most 2 GB for AgentCore; the tools functions', arm64, with the programs too
large for it; the GPU and CPU jobs', amd64) are made by CodeBuild in your account (src/infra/images.ts):
Prebuilt (the default): CodeBuild copies trace's published image for exactly this source from Amazon ECR Public,
<registry>/trace-agent:<content tag>, /trace-tools: and /trace-gpu:, into the installation's own private
repository. The
content tag is a hash of what goes into the image, computed the same way by the stack and by trace's release
workflow (scripts/image-tag.mjs), so a modified trace never takes an image that is not its own. The copy is pinned:
scripts/resolve-image.mjs reads the tag's digest from the registry and checks it against the manifest's own
bytes, the image is pulled by that digest, its digest is checked again after the pull, and only then is it re-tagged
and pushed. When the tag is not published (an unreleased commit, a fork), or no registry is set, it builds instead.
<registry> is found at install time: the source repository's trace-images release, which publishing writes
(below), names it. Nothing published yet, so always built until then. Advanced → "Published images registry"
overrides it, and PUBLISHED_REGISTRY in src/infra/props.ts can pin one for a fork; neither is needed.
AgentCore would also run an image straight from public.ecr.aws (its containerUri accepts it), and Batch could
pull one; trace copies it anyway, so the runtimes and jobs pull from the account's own registry in their region (no
public pull rate limits, no dependence on ECR Public at each cold start, the image stays if a release is withdrawn),
and the private repository keeps its lifecycle rule (the last 10 images).
Build: docker build with BuildKit's inline cache: the previous image (:cache) is the cache, so a rebuild
after an upgrade redoes only the layers whose inputs changed, and CodeBuild's local Docker layer cache helps a build
soon after another.
An installed trace has no package-lock.json or .npmrc (npm never packs them), and both the images and the CDK's
Lambda bundling need the lock file: npm run build copies both into agent/, which npm packs
(scripts/stage-image.mjs, src/infra/lockfile.ts).
trace's own images are published to Amazon ECR Public from one AWS account, the project owner's, so every
installation can copy them. Publishing is a step of the install itself, with no prework: when the GitHub token you
install with administers trace's source repository, the installer sets publishing up from that account and starts
the first release (the preflight says so, and Advanced → "Publish trace's images" turns it on or off). Nothing is
done in the console, and nothing is edited or committed. tracectl release setup --publish does the same on its own.
It (src/installer/release.ts):
src/infra/release.ts; npm run deploy:release deploys it alone): the public repositories trace-agent
and trace-tools (linux/arm64) and trace-gpu (linux/amd64) with their gallery catalog data, and the release role trace-release,
which GitHub OIDC lets only the source repository's main and v* tags assume, and which may only log in and push
to those three repositories (the account's GitHub OIDC provider is used when it has one);public.ecr.aws/<alias>, with DescribeRegistries. The alias is the registry's
default one, which ECR Public assigns by itself once the account's first public repository exists, so a new
registry gets it right after the deploy (setup waits a minute for it). A custom alias is the only kind that needs
the console, and trace does not use one. The gallery display name is set with PutRegistryCatalogData;TRACE_RELEASE_ROLE and TRACE_IMAGE_REGISTRY with the GitHub token you
gave (REST);trace-images release (a pre-release, never "latest"), where every
installer finds it;workflow_dispatch; the CLI with --publish) and prints where the images appear
(public.ecr.aws/<alias>/trace-agent, https://gallery.ecr.aws/<alias>/trace-agent, and the same for trace-tools and trace-gpu).From then on every merge to main and every v* tag publishes (.github/workflows/release-images.yml, which does
nothing until both variables are set). It runs on the source repository's own AWS build runner, which the
installation makes (with Docker, when it publishes; see Where builds run), and on GitHub's
ubuntu-24.04 runner until that exists. It builds both images with BuildKit, caches in the registry
itself (:cache, mode=max), attaches an OCI provenance attestation, tags the content tag plus latest on main and
vX.Y.Z on a tag, and records each pushed digest in the job summary. Installations look there from then on by
themselves: each install reads the trace-images release, and copies its version's images when they are published.
tracectl upgrade              # pull the newer trace (npm install -g github:mteichtahl/trace#main), then redeploy with the
                           # saved answers and refresh each repository's variables and workflows
tracectl upgrade --check      # what it would change, without changing anything
tracectl upgrade --runner-auth token|connection|auto   # switch how the build runners reach GitHub (Where builds run)
tracectl upgrade --connection ARN|auto   # choose the GitHub connection the build runners use (auto: the installer's pick)
tracectl uninstall            # remove it (asks you to type the stack's name; --yes to skip)
Running trace from a clone (npm link)? tracectl upgrade doesn't pull it from GitHub: update the clone (git pull && npm ci && npm run build), then run tracectl upgrade --no-pull.
Both use the answers saved on this machine and your AWS credentials; the GitHub token is read back from the
installation's own secret, so neither asks for it. tracectl uninstall removes the integrations' secrets, each
repository's trace variables (TRACE_CODEBUILD_PROJECT among them) and TRACE_TOKEN, trace's own repository's
TRACE_UPDATE_ROLE, TRACE_STACK and TRACE_AWS_REGION (see Staying up to date), the stack (and with it the
build runners and their webhooks), then CodeBuild's GitHub credential when trace imported it, and lists what stays (a
GitHub connection the stack created among it): with keep data (retainData, the default) the central
bucket, the image repositories, each project's memory, log groups and knowledge-base vectors; always the Cognito user
pool, the API's token secret, the CDK bootstrap, Transaction Search and the files onboarding added to each repository.
--delete-data also deletes what would block installing again with the same prefix (the image repositories, the token
secret, the user pool) and prints the commands for the bucket and the memories.
Each project's agent runs Claude with Bash, so it can use its runtime's AWS credentials directly. The line between
projects is therefore drawn in IAM, not only in code (src/infra/project.ts):
| Isolated per project | How |
|---|---|
| Worker runtime | One AgentCore runtime per repository (<prefix>_w_<hash>, tagged trace:project), with its own execution role and TRACE_PROJECT=owner/repo. It refuses, with a 403 that is logged, any invocation or job for another repository. |
| Memory | One AgentCore Memory per repository (<prefix>_m_<hash>, tagged trace:project), its own event expiry, and its own log group and log delivery. The worker is told only its own (TRACE_MEMORY_ID) and its role may use only that memory's ARN. On it, the role may still create and list events only for actors <owner>/<repo>/*, and recall and list records only under /trace/<owner>/<repo>/* (the condition keys bedrock-agentcore:actorId and bedrock-agentcore:namespace), as defence in depth. The actor comes from TRACE_PROJECT, never from the request. The GitHub OIDC role has the same grants on the same memory, for the worker.runner = actions fallback (the repository variable TRACE_MEMORY_ID). |
| S3 | Read and write projects/<owner>/<repo>/* and jobs/<owner>/<repo>/*, and list only those prefixes and central/*. Read, never write, prompts/* (the installation's prompt overrides, see Managing prompts). Nothing under access/*, and nothing of another project. |
| GPU and CPU jobs | Two AWS Batch job definitions per project (<prefix>-gpu-<hash>, and <prefix>-cpu-<hash> with the CPU queue), with one job role that reads and writes only that project's jobs/<owner>/<repo>/*. A project's role may submit only with its own definitions, only jobs tagged trace:project=<owner>/<repo>, and may stop only jobs carrying that tag. SubmitJob cannot override a definition's job role. |
| Tools and cad functions | Nested layout: two AWS Lambda functions per project from the tools image. The tools function (<prefix>-tools-<hash>) runs trace's own programs (KiCad, Blender, the FPGA tools, CalculiX, ffmpeg, the enclosure engine's checks) on a role that reads and writes only jobs/<owner>/<repo>/* and its own log group. The cad function (<prefix>-cad-<hash>) runs the project's case script (mechanical/case.py, code a person or a pull request wrote) on a role that may write its own log group and nothing else: no S3, no X-Ray. The worker signs 20-minute URLs for that one job's files and sends only those (src/gpu/urls.ts), so a script that reads the runner's credentials or /proc finds nothing that reaches another object, and whatever it writes back is a claim the tools function measures. Only the project's worker may invoke either. The flat layout has its tools functions in one nested stack and no cad functions: a custom case script builds there on a laptop or in CI. |
| Events | Nested layout only. One SNS topic per project, <prefix>-<hash>-batch-events, and up to two EventBridge rules sending it events: its own Batch jobs' state changes (with GPU jobs), and <prefix>-<hash>-journey-events, the central bucket's "Object Created" event for its journey record (projects/<owner>/<repo>/journey/journey.db, which only the API writes), its job index (journey-agent/jobs.db) and its agents' facts (journey-agent/facts.db, where a hand-off's answer is written). Only those rules may publish to it. A worker waiting on a job, on a person's answer in journey.ask, or on a hand-off's answer in journey.handoff, subscribes a short-lived queue of its own (<prefix>-<hash>-wait-*) and is told at once. It still checks on a slow timer (30 seconds and 90 seconds after subscribing, then every 5 minutes) in case a message is lost. Without the topic (flat layout, or an older stack) it checks on a timer and says when it will look next. |
| Knowledge base | One Amazon Bedrock knowledge base per repository (<prefix>-kb-<hash>, nested layout only), with its own service role (<prefix>-kb-<hash>-<region>) that reads only projects/<owner>/<repo>/kb/* and its own S3 Vectors index, and invokes only the embedding model. The worker role and the OIDC role may bedrock:Retrieve and start, get and list ingestion jobs on that knowledge base's ARN only. See Knowledge base. |
| Library gateway | Off by default (gateway.enabled). When on, each worker role may bedrock-agentcore:InvokeGateway on the installation's one library gateway and nothing else of it; the gateway serves only the shared datasheets and parts tools. See Library gateway. |
| GitHub OIDC role | One per repository, trusted only for repo:OWNER/REPO:ref:refs/heads/BRANCH, and for the same branch under GitHub's immutable subject repo:OWNER@OWNER_ID/REPO@REPO_ID:… (what GitHub sends for repositories created, renamed or transferred after 15 July 2026, or opted in; the installer reads the ids from GitHub). It may invoke only that project's runtime, read and write only that project's prefix (and the central database), and use only that project's memory and knowledge base, as its worker does. |
| GitHub token | Each project has its own secret, <prefix>/github-token/<owner>/<repo>, and its worker reads only that one. This isolates GitHub access only when you give the project its own fine-grained token limited to that repository. By default the shared token is copied into every project's secret, and the installer's summary says so. A project token is checked: it must see its repository, and the installer warns if it can also see another project's. |
Shared on purpose:
central/: datasheets and the parts database). Every project reads it. Every project
may also write it, because adding a datasheet is a shared write, but only with a conditional put (If-Match or
If-None-Match, which is how the central store always writes) and never a delete. The bucket is versioned.gateway.enabled): one AgentCore Gateway and its Lambda, which reach the central
store and the distributor keys only. See Library gateway.settings.get and settings.set on any project. It reads (never writes) the records of every project's
memory for memory.list and memory.recall, choosing the memory of the project asked for after the access check,
it may bedrock:Retrieve on every project's knowledge base for kb.search, again after the access check,
and it may invoke every project's worker: each by its exact runtime ARN, and the runtime only when it carries this
installation's tag trace:installation=<prefix> (aws:ResourceTag, which the Service Authorization Reference
lists for both of InvokeAgentRuntime's resource types, runtime and runtime-endpoint; the endpoint statement names
the exact ARNs only, because the DEFAULT endpoint AgentCore makes is not tagged by the stack). No name pattern, so
another installation in the account is out of reach. It does all of this only after its
Cognito access check. It runs no model and no agent, and nothing reaches a shell through it: a task is handed to
the project's own worker runtime.DescribeJobs in AWS Batch has no resource-level permissions, so any project's role can describe (not change) any
job on the queue, which includes its command and environment. Job ids, not data, are what that reveals.
An installation holds up to 60 projects. Each project's resources (its worker runtime and execution role, GitHub
OIDC role, token secret, memory with its log group and log delivery, GPU and CPU job definitions and job role, and its
knowledge base with its index, service role and data source: 23 CloudFormation resources with everything on) are a CloudFormation nested stack of their own, Project<hash>Stack
(src/infra/project.ts ProjectNestedStack). The parent stack holds the shared parts and one
AWS::CloudFormation::Stack per project. What a project uses of the parent (the bucket, the agent image and its
repository, the OIDC provider, the GPU and CPU queues, image repository, execution role and log group) reaches its
nested stack as parameters (the S3 vector bucket too), and the parent waits for Transaction Search before it creates or updates a project (not
for the GPU image: see GPU jobs).
Inside, the resources are the ones the single stack had, with the same names, IAM and removal policies (with
retainData, a removed project's memory, log group and log delivery stay in the account, as before).
| Projects | Parent stack: resources / outputs | Each project's nested stack: resources / outputs / parameters |
|---|---|---|
| 1 | 89 / 20 | 23 / 15 / 12 |
| 24 | 115 / 20 | 23 / 15 / 12 |
| 60 | 152 / 20 | 23 / 15 / 12 |
(Everything on, including the legacy memory's one-deploy output and the CI runners' role. The knowledge bases add the vector bucket to the
parent, and to each nested stack five resources, its two outputs Project<hash>KnowledgeBaseId and
Project<hash>KnowledgeBaseDataSourceId, the knowledge base id the parent reads for the API, and the vector bucket's
parameter. From 24 projects, CDK moves part of the API role's policy, which names every project's memory, worker
runtime and knowledge base, into managed policies of that role: three at 24 and four at 60, of the ten a role may have
by default. The tools functions add five resources and the ToolsImageUri output to the parent, for the tools image
(its repository, its CodeBuild project with its role and policy, and its build), and to each nested stack four
resources (the function, its role, policy and log group: src/infra/tools.ts) and three parameters (the tools
image's repository and tag); the cad function (CadFunction, the case script's) adds the same four to each nested
stack, 39 with everything on. The flat layout has no room for those per project, so its tools functions are all
in one nested stack, one resource of the parent's, left out when the parent has no room even for that, and it has no
cad functions: see agent/README.md.)
CloudFormation allows 500 resources, 200 outputs and 200 parameters per template, and the stack checks all three
when it is built. The parent carries none of a project's outputs, so its output count does not grow with the
projects. Each project's are its nested stack's, under the names they always had (Project<hash>RuntimeArn,
Project<hash>ActionsRoleArn, Project<hash>MemoryId, Project<hash>GithubSecretArn,
Project<hash>GpuJobDefinition, Project<hash>LogGroup, Project<hash>MemoryLogGroup), with Repository
(owner/repo). The installer lists the parent's resources (ListStackResources: DescribeStackResources returns
only the first 100), takes each AWS::CloudFormation::Stack whose logical id is Project<hash>Stack…, reads its
outputs with DescribeStacks on its physical id, checks its Repository output against the hash, and takes only the
outputs named for that hash (src/installer/aws.ts stackOutputs). The flat layout keeps its outputs in the one
stack, as before. The other limit at 60 is the API's three owner/repo=<id> lists (see
Agent memory): very long repository names can reach their 5000 characters first, and the stack says
so when it is built. The output Layout says which layout an installation has.
cdk deploy uploads each nested template to the CDK bootstrap bucket as a file asset, the same way it already
uploads the agent source and the Lambda code, so the bootstrap the installer runs (version 6 or later) covers it.
Installations from before nested stacks keep layout: 'flat'. There every project's resources are in the one
stack, and it holds about 20 projects (cdk synth refuses more). A flat installation has no knowledge bases and no CPU
queue: at about 480 of its 500 resources with 20 projects, it has no room for them. The installer picks the layout from the deployed
stack: a stack with a Layout output keeps that layout, a stack without one is flat, and a new installation is
nested. Deploying by hand, set layout: 'flat' in TRACE_INFRA for an older stack.
Moving a flat installation to nested stacks is a choice in the installer ("Move to one nested stack per project"), because it deletes every project's memory records. CloudFormation cannot move these resources in place:
| Resource | What a plain switch to nested would do |
|---|---|
AgentCore runtime (<prefix>_w_<hash>), memory (<prefix>_m_<hash>), IAM roles (<prefix>-w-, -gh-, -gpu-<hash>-<region>), secret (<prefix>/github-token/<owner>/<repo>), delivery sources and destinations (<prefix>-m-<hash>-…) | CloudFormation creates a moved resource before it deletes the old one, and these names are fixed, so the nested stack's create fails on the first name already in use and the update rolls back. Nothing is lost, and nothing moves. A memory with retainData is also Retain, so even after its old copy is removed its name stays taken. A deleted secret can keep its name through its recovery window. |
Batch job definition (<prefix>-gpu-<hash>) | Would work: registering an existing name adds a revision, and deleting the old resource deregisters only its own revision. |
A memory's log group (/aws/vendedlogs/…/<memory id>) | Named after the memory's id, so a new memory gets a new log group. The old one stays with retainData. |
CloudFormation stack refactoring (2025, and cdk refactor) moves resources between stacks, nested ones included,
but only as an operation that creates, deletes and modifies nothing. This move has to create the nested stack
resources and their parameters, and to change the API runtime's environment, the API role's policy and the outputs
to read from the nested stacks. That would take a separate deploy for each of those changes around a refactor, and
refactoring also requires every moved resource type to be fully mutable, which has not been confirmed for the AgentCore
resource types. It was not chosen. Renaming everything once (a version suffix) would keep the records but change every
name for good, and the names are how projects are told apart in IAM.
The move is therefore three deploys in a row, run by the installer:
retainData; layoutMigration: 'release'): the same stack, with each project's memory and
its log delivery marked Delete. Nothing else changes.layoutMigration: 'drain'): every project out of the stack. CloudFormation deletes each project's
runtime, roles, secret, job definition, memory with every record in it, and log delivery. With retainData, each
memory's log group stays in the account. The API is told no workers, so the projects are offline from here.layout: 'nested'): every project again, each in its own nested stack, with an empty memory. Just
before it the installer force-deletes any project secret still in its recovery window (they are copies of tokens,
and it writes them again straight after). Then it rewrites every repository's variables as usual.Workflows that run between the second deploy and the variable update fail; re-run them. If a deploy fails, run the installer again: it carries on from the layout the stack is then in.
What a flat installation gets, and why the move is the way on. Projects created in the web app are added to a flat
installation by the self-update too, while it holds fewer than 15 projects (FLAT_UPDATE_MAX, src/installer/pending.ts;
each project is about 21 of the stack's 500 resources, and an unattended deploy keeps room for trace's own changes);
past that, by the next installer run. They get their agent, memory and build runner, but no knowledge base, CPU queue or
per-project events topic, so an agent waiting in journey.ask checks the record on its timer. Giving the flat layout
those was rejected: the knowledge base (5 resources), the CPU job definition (1) and the events topic with its policy
and rule (3) would take 20 projects past 500 resources, so the flat cap would drop to about 15 for every existing
installation. The self-update never moves the layout, because the move deletes every project's memory records, which
is a person's call; the installer offers it ("Move to one nested stack per project"), and the app says all of this on
New project and Admin › Installation (installation.layout), with the move's steps and what it costs.
Upgrading an installation from before per-project roles. The next installer run replaces the single worker
runtime (<prefix>_agent), its role, the one GitHub OIDC role (<prefix>-github-actions-<region>) and the one GPU
job definition with one of each per project, and rewrites every repository's TRACE_AWS_ROLE and
TRACE_AGENT_RUNTIME_ARN. Workflows that run between the deploy and the variable update fail to assume the old
role; re-run them. The shared <prefix>/github-token secret stays, as the API's. GPU job files written under the
old jobs/<id>/ layout expire with the bucket's one-week rule.
Upgrading an installation from before per-project memory. The installation-wide memory (<prefix>_memory) is
removed and every project starts with its own, empty memory. See Agent memory for what happens to
the old one's records.
Everyone signs in with Amazon Cognito (tracectl login). Each person is in one of three classes:
| Class | What they can do |
|---|---|
| admin | Everything, on every project. This includes inviting people, setting classes and assigning projects. |
| user | Read and write, only on the projects they are assigned to. |
| guest | Read only, only on the projects they are assigned to. |
tracectl remote task), and using the tools that
record runs.A person's class is their Cognito group (trace-admins, trace-users, trace-guests), so it travels inside their
signed token. Someone in none of these groups can do nothing. Project assignments live in the central database.
Someone not assigned to a project cannot tell that it exists.
The API runtime checks every request against these rules. Each repository's own workflows reach only that project's worker runtime, through IAM, so a person's sign-in never acts as the loop, and the loop never acts as a person. Admins manage people with:
tracectl users invite EMAIL --class user|guest|admin
tracectl users class EMAIL guest
tracectl users assign EMAIL OWNER/REPO
tracectl users unassign EMAIL OWNER/REPO
tracectl users list
tracectl users assignments
The installer sets up the first admin and anyone else you list, with their classes and projects.
Changing a project's prompts takes write access on it, and the installation's prompts only an admin can change; guests can list, read and preview them (see Managing prompts).
Marking an agent memory inactive (tracectl remote memory deactivate) takes write access. A person's own preferences
are the exception: they may mark those with read access alone (see Inactive memories).
A connected system is another system or AI agent that calls trace with its own keys: a build dashboard, a release pipeline, a script, an MCP client. Each one has a name, what it may do (read, or read and change) and the projects it is on, as a reviewer or a contributor, exactly like a person. A project it is not on does not exist for it. The design is in docs/external-access.md.
Turning it on. External access is off until an admin turns it on: run tracectl install, open External
access, switch it on and deploy. That adds a sign-in for systems and two addresses, one for scripts (the external
API) and one for AI agents (the MCP endpoint). Both cost nothing while nobody calls them. With it off, the admin screen
and tracectl services say so, and nothing outside can get in.
Connecting one. In the web app, Admin → Connected systems → Connect a system: a name, what it is for, what it may do (Read only is recommended: it can look but not change anything) and its projects. A read-only system is always a reviewer. Or from the command line:
tracectl services create build-dashboard --scope read --project acme/soil-sensor --description "The lab's wall screen"
tracectl services create release-bot --scope write --project acme/soil-sensor:contributor
tracectl services list
tracectl services show build-dashboard
Both show the client id and the secret once, with the sign-in (token) address, the API address and the MCP address. trace does not keep the secret: store it at once, in a password manager or the other system's secret store.
Getting a token. The system swaps its client id and secret for a sign-in token that lasts an hour:
curl -s -u "$CLIENT_ID:$TRACE_CLIENT_SECRET" -d grant_type=client_credentials \
  --data-urlencode "scope=trace-external/read" "$TOKEN_URL"          # trace-external/read trace-external/write to change things
Calling the API. The same { action, ...args } JSON as the app, with the token:
curl -s -X POST "$API_URL" -H "Authorization: Bearer $TOKEN" -H 'content-type: application/json' -d '{"action":"projects"}'Connecting an AI agent. Point an MCP client (Claude Code, for example) at the MCP address. It gets one tool per action the system may use:
{ "type": "http", "url": "<MCP address>", "headers": { "Authorization": "Bearer <token>" } }What a system can and can't do. With read it can see the projects it is on: their status, settings, runs and
artifacts, jobs, requirements, design, build and cost records, files, the knowledge base, and the read-only tools.
It can also read trace's records the way trace names them: the ontology's terms (ontology.describe), any record
as JSON-LD (record.get), what a run was made from (artifact.lineage) and which runs no longer stand
(artifact.stale).
With read and change it can also, where it is a contributor, give the agents work, pause or cancel its own jobs,
propose a settings change (as a pull request a person merges), sync the knowledge base and run tools that record
runs. Never, whatever it may do: anything that needs an admin, signing gates, answering questions, waivers, design
decisions, orders, chats, preferences, memory, prompts, people and assignments, or the tools of the shared datasheet
library and the parts search (shared by every project, and the parts search spends the installation's paid quota).
Those stay with a person. Anything else answers "no access", the same words as a project that isn't yours.
Limits. Each system may make 10 requests a second and 300 a minute, counted across the whole installation; over
that it is answered 429 with Retry-After, the number of seconds to wait. It may have at most three tasks queued or
running on one project; a fourth is refused until one finishes. An unexpected failure is answered
internal error (ref …): the reference finds the details in the external runtime's log (ExternalLogGroup).
Stopping and rotating. Disabling a system stops it within 30 seconds; deleting it disables it first, then removes its keys and takes it off every project. A new secret works beside the old one, so the system can switch without stopping; retire the old one once it has:
tracectl services disable release-bot          # enable to let it in again
tracectl services rotate build-dashboard       # prints the new secret, once
tracectl services retire-secret build-dashboard OLD_SECRET_ID
tracectl services delete release-bot           # asks you to type the name; --yes skips that
tracectl services history build-dashboard
Every command takes --json. The web app has the same on each system's page.
A leaked secret. Disable the system first, then rotate, retire the old secret, give the new one to the system, and enable it again. Rotating alone is not enough: the old secret keeps working until it is retired, and a token already issued lasts up to an hour, which disabling stops at once.
tracectl services disable build-dashboard
tracectl services rotate build-dashboard
tracectl services retire-secret build-dashboard OLD_SECRET_ID
tracectl services enable build-dashboard
Cost. Each system's keys are checked with Amazon Cognito, which charges a small amount per system and per sign-in. A system that reuses its token for the hour makes about 720 sign-ins a month. The shared request limit is a small DynamoDB table, billed per request (two small writes per call).
What it runs as. The external API has an AWS role of its own, with only what systems' actions need: it cannot manage people or keys in Cognito at all. The details are in docs/external-access.md.
The installer sets up a web app beside tracectl login: one address where people sign in and work with their projects.
It is on by default and needs nothing more at install time. It is built from web/ (the app) and src/web/ (its
backend) when the stack is deployed, and lives in its own nested stack (src/infra/web.ts).
| Part | What it is |
|---|---|
| Address | A CloudFront distribution: CloudFront's own address (https://<id>.cloudfront.net, the WebUrl output) unless a custom domain is set. HTTP/2 and HTTP/3, price class 100 |
| The app | A private S3 bucket that only this distribution can read (origin access control). index.html is never cached; Vite's hashed files under assets/ are cached for a year. Any path without a dot loads the app |
| Backend | A Lambda function (Node.js 22, arm64, response streaming) behind /api/* on the same address. Only CloudFront can call its function URL (IAM auth, origin access control). It reads its settings from one SSM parameter, /<prefix>/web/config |
| Live updates | AppSync Events, <prefix>-events. People subscribe with their sign-in, each to /trace/users/<their id> only. Only the backend, and the agents' facts function below, can publish |
| GitHub's webhook | (web.hooks, on by default) Each project repository's webhook (pull requests, checks, statuses) posts to /api/hooks/github, which goes to a small function of its own, <prefix>-web-hooks. CloudFront adds a random header only it knows, and the function drops anything without it before reading the rest; it checks each delivery's signature against the secret <prefix>/web/github-hooks (the installer makes it and registers the hooks), drops a delivery id it has seen, asks the API runtime who is on the project, and tells their screens to look again, once or twice per push. A repository the token may not add a webhook to is a warning; its screens look again every 60 s. docs/guided-flow.md "Live updates" |
| Agents' facts | When an agent records a journey fact (a question, a check, a stuck report), the central bucket's event reaches a small function, <prefix>-journey-events, through an EventBridge rule. It tells everyone on that project to refresh, and notifies the people a new question or stuck report is for. Its role may read the access store and the agents' facts files, and publish live events. Nothing else |
| Sign-in | A Cognito app client of its own, <prefix>-web, using choice-based sign-in. People sign in with a passkey or a password, plus an email code when SES is set (see below). The CLI keeps its own client |
| Voice | Polly speech kept 30 days in a small bucket of its own. The browser gets signed URLs for it and for Transcribe streaming. Dictation in a project uses that project's own words (below) |
The backend's role can read its settings and use Polly, Transcribe streaming, its voice cache, CloudWatch (read only), the chat model, and publishing live events. It cannot reach the access store, any project's data or Cognito's admin API. Anything about a project goes through the API runtime, with the person's own token, so the access checks stay in one place.
Dictation with the project's words. Each project gets an Amazon Transcribe custom vocabulary made from its design,
so dictation writes U4, R14, STM32F405RGT6, VCC_3V3 or REQ-LAY-001 as the design spells them. Every push to
the default branch remakes it (the voice-vocabulary job of trace-worker.yml, tracectl tool voice.vocabulary, with
the project's own role); voice.vocabulary.sync does it on demand through the API. The table
(projects/<owner>/<repo>/voice/<language>.txt) has one row per way of saying a name: a reference designator's
letters spelled and its number said digit by digit or as a number ("R one four", "R fourteen" → R14), a part number or
net spelled with its words kept ("Buck E N" → Buck_EN), with Transcribe's rules for a phrase (letters and hyphens, single
letters with periods, no digits, at most 256 characters, at most 50 KB in all; SoundsLike and IPA are left empty,
since Transcribe no longer uses them). It is named <prefix>-<project hash>-<language>, for the languages in the
project setting voice.languages (default en-AU; English only, as the spoken numbers are English; Transcribe allows
100 vocabularies per account by default). When the microphone opens, the backend asks the API (voice.vocabulary, as
the person) and names the vocabulary in the signed streaming URL only when it is ready; the app says whether the
project's words are in use. Waiting for a vocabulary to be ready is a timer (every 10 seconds, growing to a minute),
declared: Transcribe's "Vocabulary State Change" event is sent only when a vocabulary is first made, not when it is
updated. IAM: each project's worker and OIDC roles may create vocabularies only tagged with their own project and
update and read only their own names; the API role may only read their state; the backend role gets nothing new. Turn
it off per project with voice.vocabulary = false.
Ask trace's instructions. An admin's change to chat.role at installation scope (Admin › Prompts, or
prompts.set) reaches the chat agent within a minute. The backend cannot read the prompts store, and is not given
read access to it: the store is one database holding every prompt's override and its history, and S3 cannot grant
part of one object. Instead it asks the API for prompts.chat, which answers only the editable chat entries, and
keeps the answer for 60 seconds per Lambda container. A change made through the app clears that container's copy at
once; other containers pick it up within the 60 seconds (the live record.changed event reaches browsers, not the
Lambda). The locked chat entries (the data fences) always come from the code.
Every response carries strict security headers: HSTS, nosniff, X-Frame-Options: DENY, and
strict-origin-when-cross-origin. The content security policy allows only these:
data: and blob: URLsAWS WAF. On by default (Advanced → Web app, "Protect the app with AWS WAF"; web.waf). The app's address is public
and sign-in takes no token, so a web ACL sits in front of it (src/infra/edge.ts): AWS's managed rule groups (the core
rule set, known bad inputs and the IP reputation list), at most 10,000 requests to /api/* and 200 to /api/auth/* per
address in 10 minutes (web.waf.apiRequestsPer10Minutes, authRequestsPer10Minutes; over them a 429; settings saved with
the older …Per5Minutes keys are read as twice those), and no request to
/api/* declaring a body of 5 MB or more (the chat's limit is 4 MB). The core rule set's 8 KB body limit and its body
cross-site-scripting rule only count, since a chat or a prompt is larger and people paste code; the app renders no HTML
from them. It costs about US$11 a month (US$5 for the web ACL and US$1 for each of its six rules) and US$0.60 per
million requests. That is the default because the alternative is sign-in with no limit per address; turn it off for a
private trial. CloudFront takes web ACLs from us-east-1 only: in us-east-1 the web ACL is in the web app's own stack;
elsewhere the installer deploys a small stack of its own, <prefix>-edge, in us-east-1 first (bootstrapping CDK there
if needed), and deploys the main stack with its WebAclArn output as web.waf.aclArn. Passing that one value between
two deploys was chosen over CDK's crossRegionReferences, which would add a custom resource (a Lambda and its role) and
an SSM parameter the two stacks would then hold each other to. The self-update deploys <prefix>-edge too, with the
CDK bootstrap roles of us-east-1 and the right to read that stack's outputs only; it never bootstraps us-east-1, so
when that is missing it keeps the web ACL the app had and says to run the installer. A failed edge deploy never stops
the main one. Turning the WAF off deletes <prefix>-edge after the main deploy, and tracectl uninstall deletes it
too. A web ACL of your own (web.webAclArn) is used instead when given. Admin → Installation says whether it is on.
Custom domain. Under Advanced → Web app, give a domain and its ACM certificate (it must be in us-east-1). After the
deploy, point the domain's DNS at the distribution with a CNAME or alias (WebDistributionId). The props for this are
web.domainName and web.certificateArn.
Passkeys. Each passkey belongs to the app's address, which is the user pool's relying party. If you move from CloudFront's address to a custom domain later, people have to register their passkeys again. Their passwords still work.
Email codes. Cognito sends sign-in codes by email only through Amazon SES. Without SES (the default), people sign
in with a passkey or a password, and Cognito's own sender still sends the invitations. To add codes by email, give a
verified SES sender under Advanced (web.sesFrom). The pool then sends all its email through SES.
The invitation email points at https://<address>/invite as well as tracectl login. The installer's last card has an
Open trace button. Turn the app off with Advanced → Web app (web.enabled: false). Other stack settings:
web.model (the chat model, which defaults to model) and web.dashboards (extra CloudWatch dashboards for the
Operations page, beside <prefix>-agents).
Cloud cost per project. Each project's spend is kept in a cost ledger in the central bucket, beside its agents'
facts (projects/<slug>/journey-agent/cost.db, src/core/cost.ts), not in the repository: money is for admins only.
Agents. Every Claude run records each model's tokens (the Agent SDK's result) with its job and agent, priced from the price table.
Graphics card and CPU jobs. Every finished AWS Batch job records its running time (Batch's start and stop times) times its pool's price: a graphics card job holds its instance, a CPU job pays for the vCPUs it asked for.
Tools function jobs. Every call of a project's tools function (KiCad, Blender on the CPU, the FPGA and
verification tools, CalculiX, ffmpeg: agent/README.md) records Lambda's billed duration (a cold start included)
times its memory and its /tmp over 512 MB, plus the call, at Lambda's arm64 prices. The price list fetch does not
ask for Lambda yet: the built-in price (us-east-1), or cost.prices.tools, prices them.
The price table (src/core/prices.ts) is one dated table: Claude on Bedrock per million tokens per model
(input, output, cache write, cache read; a global inference profile's price and the higher in-region one) and the
two pools' prices per hour. Its prices come from three places, highest first:
cost.prices (a model entry, a region-only entry, a pool, tools, and an
asOf; run the installer to apply): the workers and the API get them as TRACE_PRICES.cost.explorer.at) asks
the AWS Price List Query API (pricing:GetProducts, free) for Claude on Bedrock in the installation's region
(service code AmazonBedrockFoundationModels, on-demand, Anthropic) and for the pools' instances on demand
(AmazonEC2: the GPU pool's first instance type per hour, the CPU pool's first family's xlarge per vCPU), and
writes the table to installation/cost/prices.json, dated the day it fetched (src/core/price-list.ts,
src/core/prices-store.ts). Its endpoint is the nearest of the three the API has (us-east-1, eu-central-1,
ap-south-1; cost.priceList.endpoint picks one). It takes the configured models (model, web.model) and the
current Claude family (version 4 on). The price list names models by display name ("Claude Sonnet 4.6"), not by
id, so each becomes a match key (claude-sonnet-4-6); it gives no Spot prices, and for some models no cache
prices. A field it lacks is taken from the built-in entry of the same model, and a model it lacks (a newly
released one) is priced by the built-in table; the notes on Cost and time say which. No price is made up. A
failed fetch keeps the last table fetched and says why and when it tries next. cost.priceList.enabled: false
turns it off.Workers read prices.json at most once an hour (their role may read that one key of installation/ and nothing
else of it). Every row of the ledger records the date and the source (override, fetched, built-in) of the
price that priced it. Cost and time and Admin › Usage and cost say where the prices come from ("prices from the AWS
price list, fetched …"), warn when the fetch failed and the last or built-in prices are in use (with why and the next
try), say when the built-in table is more than six months old, and how many rows each source priced. Every figure
from the table is shown as an estimate.
What AWS billed. Every project resource carries the trace:project and trace:installation tags. A Lambda,
<prefix>-cost-explorer, reads Cost Explorer once a day (cost.explorer.at, default 06:17 UTC), grouped by
trace:project and service, and writes per-project actuals into installation/cost/actuals.db. Cost Explorer can
group by a tag only once it is activated as a cost allocation tag, a billing setting made once per account. With
cost.explorer.activateTags (default on) the Lambda activates it (UpdateCostAllocationTagsStatus); in a member
account of an AWS Organization only the management account may, so activate trace:project (and
trace:installation) once in the Billing and Cost Management console, under Cost allocation tags. Billing lists a
new tag up to a day after the first tagged resource exists, activation counts cost from then on only, and a day's
figures settle about 24 hours later. The screens say all of this, and when the next read is. Model use and the
shared job machines are not tagged per project, so for those the estimate is the per-project figure. Each run makes
two to four Cost Explorer requests (US$0.01 each). The Lambda's role may call ce:GetCostAndUsage,
ce:ListCostAllocationTags, ce:UpdateCostAllocationTagsStatus (with activateTags) and pricing:GetProducts
(none of these take a resource, so *), and read and conditionally write installation/cost/* only. With
cost.explorer.enabled: false and the price list on, it only fetches prices.
cost.get (Cost and time, and the gate's cost line) and usage.month (Admin › Usage and cost, and Operations' cost
tile) answer from the ledger, for admins only.
Order status. JLCPCB offers order status only through its Ordering API, for partner companies it approves on
their order history and volume, so trace does not read JLCPCB. The person records the order after paying, then the
carrier and tracking number from JLCPCB's shipping notice (Build tab, order.update), and marks it delivered. With
the dhl integration set, an hourly Lambda, <prefix>-order-watch, follows each DHL parcel: its first check an hour
after the number is recorded, then less often while nothing changes (up to every 12 hours), back to hourly when the
status moves; a person can check now. The Wait line says when the next check is. It never changes an order: when DHL
says delivered, the Build tab says so and the person records it. FedEx and UPS have tracking APIs that need an OAuth
app with a shipping account; they are not built, and their parcels are not checked. Reading JLCPCB's notification
emails would need inbound email (SES receiving and a domain's MX record), which an installation does not have, so it
is not built either.
Boards and bring-up readings. Boards are recorded by serial when they arrive (Incoming inspection: board.record,
board.check), each check against a board: counted, labelled, a fault at its reference, each hand-placed part fitted
or marked as left off. They are journey tables, people's entries. A hil tool given bringup={board, step, min, max}
stores its reading against that board and bring-up step, with pass or fail, in the run record (bringup_readings, a
measurement like any other), and copies it live beside the agents' facts so the Bring-up run screen shows it as it
is taken; hil.idn stores each instrument's identity the same way. The Incoming inspection, Bench setup and
Bring-up run checks are computed from these.
Every build, test and automation job runs on AWS, in the installation's own account, once the installer has set it
up. Until then the same jobs run on GitHub's own runners (ubuntu-24.04), so nothing waits. The installer handles
all of it, including trace's own repository; there is nothing to deploy by hand.
The workflows stay in GitHub Actions, so pull requests show their checks as usual. On AWS, each job runs on an AWS CodeBuild-hosted runner: GitHub queues the job, CodeBuild receives the queued event, starts a fresh build container in your account, and that container runs the job and is discarded.
One runner per repository, <prefix>-ci-<hash>, made by the stack: one for each project, and one for trace's
own repository.
The switch is one repository variable. Every job's runs-on reads TRACE_CODEBUILD_PROJECT: when it is set,
the job runs on that CodeBuild runner; when it is not, on ubuntu-24.04. The installer sets it only once the
repository's runner exists, and removes it where the runner does not exist, so a job never waits for a runner that
isn't there. When the runner arrives, the jobs move to AWS by themselves; no workflow changes.
trace's own repository too. The installer works out which GitHub repository your trace was installed from (the
repository field of its package.json, github:mteichtahl/trace; a git checkout's own remote, or
TRACE_SOURCE, comes first). If your token can manage that repository's variables, it gets a runner of its own
(a runner only: no agents, roles or memory) and its TRACE_CODEBUILD_PROJECT. This is on by default; turn off
"Build trace's own repository on AWS too" under Advanced → Build runners to leave it on GitHub's runners. When the
installation publishes trace's images, that runner has Docker (runners.ciPrivileged) for the release workflow.
How CodeBuild reaches GitHub (to make each runner project's webhook, register each job's just-in-time runner
and fetch the source): one of two, chosen per installation (runners.auth in the answers; Advanced → Build
runners in the installer):
| GitHub connection (CodeConnections) | The GitHub token (CodeBuild source credential) | |
|---|---|---|
| Stored with CodeBuild | No token: the AWS Connector for GitHub app's installation | The personal access token, imported with ImportSourceCredentials |
| Console step | One authorization per AWS account and region, the first time | None |
| First deploy | With the runners when a connection is authorized already; else without (GitHub's runners meanwhile), then a second deploy once it is | With the runners |
| GitHub access | The app's: grant it every repository trace builds | The token's: Administration, Webhooks, Commit statuses (read and write) and Contents (read) on each repository |
Automatic (the default) uses a connection when one is authorized in the account and region already (the one
this installation used before, <prefix>-github, or another installation's), and the token otherwise, so a first
install needs only the AWS credentials and the token. The token always uses the token. A connection
(Advanced: "use an AWS CodeConnections connection instead of the token; needs one console authorization") always
uses one, and creates <prefix>-github when there is none. Switch later with
tracectl upgrade --runner-auth auto|token|connection (or by choosing again in tracectl install): the runner projects
are updated in place.
Which connection: Advanced → Build runners → GitHub connection lists every GitHub connection in the account and
region with whether it is authorized. Leave it on Automatic, which says which one the installer would reuse, or pick
one (or type another's ARN). An account can hold several, each the AWS Connector app of a different GitHub account
or organization, and only one whose app can reach your repositories makes their runners. Change it later with
tracectl upgrade --connection ARN (--connection auto goes back to the installer's pick).
When GitHub refuses a runner's webhook (the AWS Connector app not allowed on the repository, a token without
admin rights on it, an old CodeBuild webhook left on the repository, or GitHub's limit on a repository's hooks), the
deploy still finishes. Each build-only repository's runner, and each project's runner in the nested layout, gets its
webhook from a small custom resource (src/infra/lambda/runner-webhook.ts) rather than from CloudFormation, which
would roll the whole stack back. The runner project is made, its TRACE_CODEBUILD_PROJECT output says none, the
installer and the self-update leave that repository's jobs on GitHub's runners and say why, and every later deploy
tries again. The flat layout's projects keep CloudFormation's own webhook: a flat stack of 20 projects has no room
for one more resource each.
With the token, the installer imports it before the deploy as CodeBuild's account-level GitHub source credential
(ImportSourceCredentials, server type GITHUB, auth type PERSONAL_ACCESS_TOKEN; Advanced chooses the agents'
token or the admin token). The runner projects then name no source credential of their own, so CodeBuild uses that
one for their webhooks, runner registration and checkouts
(multiple access tokens:
account credentials "will be used on a project when no project or source level credentials are specified"). An
account that already has a GitHub source credential keeps it: it may be another team's, so trace uses it and leaves
it alone, and the preflight says so. One trace imported is refreshed on every run and removed by tracectl uninstall.
CodeBuild keeps the token itself: no job and no role can read it. The preflight stops when the token lacks
Administration or Webhooks on a chosen repository, because CodeBuild could not make that runner and the deploy would
fail.
With a connection, CodeBuild uses the AWS Connector for GitHub app and no GitHub token is stored for it. Grant that app access to every repository trace builds. One connection serves the whole account and region: a person authorizes it once, in the AWS console, and every installation there reuses it, and says which one it used. Nothing needs it up front:
<prefix>-github and the first deploy goes ahead without the runners
(CodeBuild can't attach a runner to a connection nobody has authorized yet). Until the build runners are added,
workflows run on GitHub's runners.A connection the stack created is kept if the stack is deleted, because other installations may be using it.
No AWS access comes with it. The runner's own role may write its logs and (with a connection) use the connection, nothing else. Jobs reach AWS exactly as they do on GitHub's runners, through their repository's GitHub OIDC role.
Bigger machines: runners.computeType sets every job's default size (large unless changed); a job can ask for
another with an instance-size: label. runners.privileged turns on Docker for jobs that build containers.
tracectl doctor owner/repo notes when a repository has no AWS runner yet. A guard test fails the build if any workflow
here or in templates/ names a runner other than its CodeBuild runner or the ubuntu-24.04 fallback.
An installation updates itself when trace's own repository changes, so nobody has to run the installer (or
tracectl upgrade) for every update. The installer is still what makes the first installation, and what adds or removes
repositories, people and integrations or changes a setting.
update-installation job of .github/workflows/ci.yml deploys the stack again from that commit. It runs only in
trace's own repository, and only once the installer has set that repository's TRACE_UPDATE_ROLE. One update runs
at a time; a newer merge waits for the one before it.installation/props.json), with how the
build runners reach GitHub (Advanced → Build runners: automatic, the token or a connection) and the connection named
there, if any. No token or key is in it: the installer refuses to save a record any of them would be in. The job
deploys with exactly those settings and this commit's code, so the images, the stack and the workflows' helpers move
to the new version.TRACE_CODEBUILD_PROJECT is set (or
removed where its runner is gone) with the shared agent token. If the token may not change a repository's variables,
the job still succeeds, and its summary lists which variable to set to what. It starts the GPU image build when that
image changed, and does not wait for it.installation/pending-projects/), and the next update adds it: the job deploys with the saved settings plus every
such project (nested layout only, at most 60 projects), marks each request added, writes the project's token secret
(a copy of the shared token) and sets its repository's variables and TRACE_TOKEN; what it cannot set, the step
summary lists. A deploy that fails counts against the request; after two, the job leaves it to the installer. To add
a project now rather than at the next merge, run the ci workflow on main by hand (Actions → ci → Run workflow). The
next run of the installer takes every such project into its own answers and clears the requests.<prefix>-self-update. That role can be used only by the ci workflow
of trace's own repository running on its default branch: its trust policy checks the repository, the branch and
the workflow file. It may use CDK's deployment roles in this account and region, read installation/*, read the
stack's outputs, check the GitHub connection, see whether CodeBuild has a GitHub source credential (never its token)
and read the shared agent token. For projects created in the web app it may also list and rewrite the requests under
installation/pending-projects/ and write (never read) the projects' token secrets (<prefix>/github-token/*).
Nothing else in the account trusts it, and no project's role can read or write installation/* (the API may only
write requests under installation/pending-projects/, with conditional writes). Deploying through CDK's roles can change anything the stack holds, so whoever can merge to
trace's default branch can change this AWS installation. Protect that branch as you would the AWS account.TRACE_UPDATE_ROLE, so the job no longer runs. It is on by default whenever trace's
own repository is built on AWS; tracectl uninstall removes the job's variables with everything else.tracectl onboard owner/repo --apply-settings # an existing repository: opens a held PR with what it adds
tracectl new owner/board --template kicad # a new one: created, scaffolded and pushed
tracectl doctor owner/repo # what is still missing, and how to fix each itemtracectl onboard and tracectl new reach GitHub with the gh CLI, signed in as you. tracectl install does the same
onboarding through GitHub's API and git with the installer's token, so it needs no gh.
Onboarding adds the following:
| What | Why |
|---|---|
.trace/project.db | The project's own SQLite database. It holds the detected settings and, later, every tool run. |
.trace/rules.md | Empty. You write the rules. Agents treat them as the authority on what to do and when to ask you. |
.github/workflows/trace-*.yml | Four thin workflows that call this repository's actions: prs, ci, worker, deploy. |
.gitattributes | Makes project.db merge row by row (tracectl db merge) instead of conflicting as a binary file. |
CLAUDE.md section | A pointer to the rules and the tools. It is appended; nothing already there is replaced. |
Settings are changed with tracectl config set <key> <value> (tracectl config keys lists them all). Each workflow has a
kill switch, a repository variable set to false: TRACE_PRS, TRACE_CI, TRACE_WORKER, TRACE_DEPLOY. Work is
done by a specialist agent (see Specialist agents) on AgentCore by default; tracectl config set worker.runner actions runs it as a GitHub Actions job instead, which
runs on the project's CodeBuild runner in AWS like every other job (or on GitHub's runners until that exists).
trace's records are SQLite databases: the ones below, and beside them in the central bucket each project's journey record, agents' facts, job index and cost ledger, the prompt overrides and the memory marks. The few other files it keeps are listed after them. The ontology that names these records and the rules over them is designed in docs/ontology.md, with its build plan in docs/ontology-plan.md; nothing of it is built yet.
.trace/project.db): one per project. It holds settings plus the run record: every
simulation, check, build and capture, with its measurements and artifacts stored as blobs. Use tracectl runs,
tracectl run <id> and tracectl artifact <id> <name> to read it.$TRACE_HOME/central.db): one for everything. It holds the datasheet library (PDFs by
sha256, page text, version history) and the parts database (stock, prices, lifecycle). Every project reads and
writes the same one. Figures taken from a datasheet are cited by part number, sha256 and page.~/.cache/tracekit/cache.db): disposable data such as parsed boards and field-solver results.The only YAML is what GitHub requires (workflow, action and Dependabot files). JSON is used only where another
program or service needs it (package.json and the tsconfig files, shadcn's web/components.json, the job files
trace hands Blender and the EMC scripts, kicad-cli's reports kept as run artifacts, and Bedrock's <key>.metadata.json
sidecars); for a few small objects in the central bucket (the installer's saved settings installation/props.json,
the price table installation/cost/prices.json, project requests under installation/pending-projects/, and when
each connected system was last seen, under access/services-seen/); for the sample project's seed files, which the
installer reads (templates/sample/settings.json and tour.json); for the design canvas's layout
(docs/ui/source/canvas.json); and for test fixtures.
tracectl tools                                   # every tool
tracectl tool calc.divider vin=12 vout=3.3       # run one
tracectl tool kicad.drc project=hw/board.kicad_pro
claude mcp add trace -- tracectl mcp             # give Claude Code all of them
Tools that drive real hardware (instruments, buses, flashing a target) are refused, and hidden from MCP, unless
TRACE_HARDWARE=1. Run them only on a machine wired to the bench. Configure the bench with tracectl config set for
hil.instruments, hil.serial and hil.can. Every power supply must have voltage and current limits.
tracectl hil emulate starts a pretend bench on your own machine, so the hardware tools can run with no instruments.
That is how the sample project tests its board. Run it inside the project's clone:
tracectl hil emulate --write-settings --serial      # keep it running; Ctrl-C stops it
TRACE_HARDWARE=1 tracectl tool hil.psu instrument=bench-psu voltage=12 current=0.05 output=on
TRACE_HARDWARE=1 tracectl tool hil.dmm instrument=bench-dmm       # about 3.0 V
The bench copies the sample board's input stage. A 39k/13k divider and an RC filter bring the 0-12 V input down to the microcontroller's ADC pin, and a diode clamps that pin at 3.3 V.
| Name | Pretends to be | What it shows |
|---|---|---|
bench-psu | Rigol DP832 power supply, port 5555 | Channel 1 powers the board. Limits are 13 V and 0.1 A. |
bench-dmm | Keysight 34465A multimeter, port 5557 | The ADC pin: a quarter of the input with the supply on, 0 V with it off. It also reads the board current, and a temperature of 25 °C. |
bench-scope | Rigol DS1104Z oscilloscope, port 5556 | Channel 1 is the ADC pin, showing the last input change as it passes the filter (rise time about 0.35 ms). Channel 2 is a 1 kHz, 3.2 V test square wave. |
bench-uart (with --serial) | The board's firmware console | Once the input is at 4 V or more, it prints adc raw=3722 mv=11998 every second and a temperature every 5 seconds. It answers READ, ID and HELP. |
bench-can | A CAN bus | python-can's virtual bus. It carries frames only between the CAN tools of a single trace process, and nothing on the bench answers. |
The command prints the settings these names need. --write-settings saves them into .trace/project.db and keeps
your other instruments. To use other ports, pass --psu-port, --scope-port and --dmm-port; 0 picks any free
port. --host sets the address the instruments listen on. The serial console needs Linux or macOS and python3
(standard library only). It is a pseudo-terminal, reached through a fixed link at /tmp/trace-bench-uart-<psu port>.
Tests start the same bench with startBench() from src/tools/hil/emulator/bench.ts.
The shared library's tools (datasheets and parts) can run behind one Amazon Bedrock AgentCore Gateway instead of in
every worker. Turn it on with gateway.enabled in the stack settings, or Library gateway in the installer's Agents
step. It is off by default, and with it off every tool runs in the worker, as before.
What moves. Only calls that need nothing on the worker's disk: datasheets.list, .find, .text, .history,
.add (from a URL), .acknowledge, and parts.lookup, .search, .alternatives, .bom_check (with rows),
.fetch_datasheet (src/core/gateway.ts LIBRARY_TOOLS). A call that names a local file or another store (file,
path, library) runs where it was made, and so do datasheets.get, .tables, .params and .page_image, which
hand back a local path or need Python or poppler. Everything that works on a project (KiCad, simulation, PCB,
firmware, hardware, memory, the knowledge base, GPU jobs) stays in the project's own worker, under its own role.
Why only the library. A Lambda target runs with the gateway's role, never the caller's, and is not told who called. A per-project tool behind a shared gateway would need a role that reaches every project, which is the line Project isolation draws in IAM. The central database is shared by every project already, so the gateway's Lambda reaches nothing a worker can't.
How a call gets there. The agent's MCP configuration does not change: tracectl mcp stays its one server. With
TRACE_GATEWAY_URL set (the stack sets it on every worker), tracectl mcp forwards these calls to the gateway as MCP
tools/call on library___<tool>, signed with SigV4 by the runtime's own credentials (the gateway's inbound auth is
AWS_IAM; an MCP client's remote configuration takes static headers only, so the signing has to be done here).
Parts calls carry the project's parts.providers and parts.currency, since the Lambda has no project. The Lambda
(src/library/lambda.ts) answers in an envelope that tracectl mcp unwraps, so a forwarded call reads the same as one run
in-process, and refuses any file, path or library whoever sends it.
When a call fails. Only a failure that means the call never ran counts as unreachable: the session could not be
opened, the connection was refused, or the gateway answered 401, 403, 429 or 503. A read then runs in the worker
instead, and tracectl mcp says so on stderr; a write (datasheets.add, .acknowledge, parts.fetch_datasheet)
reports the error. Anything else (an MCP error, the Lambda timing out, another HTTP status) may have run behind the
gateway, so it is answered as an error and never run a second time here. An expired session (404) is opened again and
the call sent once more. So while the gateway is on, library-tool writes without local inputs go only through it. A
call with file or library, and the CLI, still write central/ with the worker's role: the worker role keeps its
conditional write there, because the central database is one SQLite file that also holds the project registry
(src/core/onboard.ts), and IAM can't let a worker write one table and not the library's.
Downloads. datasheets.add and parts.fetch_datasheet download from a URL, now from the shared Lambda. Every
hop is checked against private, loopback, link-local and multicast addresses, including IPv4 written inside IPv6
(::ffff:7f00:1, 64:ff9b::/96), and the connection goes to the address that was checked, so a name that resolves
differently the second time (DNS rebinding) can't reach the Lambda's runtime API or anything else inside AWS.
Distributor keys. The installation's optional integrations (<prefix>/integrations/<name>):
with the gateway on, only the Lambda's role may read them, so no agent, which has Bash and its role's credentials,
can. The Lambda also still reads the older single secret, <prefix>/library-keys (output LibraryKeysSecretArn), for
any key the integrations leave unset; the installer no longer writes it. Without the gateway, each worker reads the
integrations itself (and its agent can read them).
Resources (src/infra/gateway.ts, in the parent stack):
| Resource | What it may do |
|---|---|
<prefix>-library gateway | AWS_IAM inbound auth, MCP. Its role (<prefix>-gateway-<region>) may only invoke the Lambda. |
library target | Lambda target, GATEWAY_IAM_ROLE credentials, its tool schema generated from the tools' zod inputs without their local inputs. Gateway's schema has no enums or bounds, so they are kept in each field's description; the Lambda validates with the full zod schema. |
<prefix>-library Lambda | Node 22 on arm64, 2 GB, 10 minutes (a 2,000-line BOM check asks the providers line by line). Role <prefix>-library-<region>: read central/*, write it only with a conditional put, read the keys secret and <prefix>/integrations/*. Nothing of projects/, jobs/, access/ or prompts/. |
<prefix>/library-keys secret | The older home of the distributor keys, read for any key the integrations leave unset; never written by CloudFormation. |
Cost. Gateway calls are $0.005 per 1,000, and tool indexing $0.02 per 100 tools a month (11 tools), at AgentCore pricing; the Lambda is billed per call. Nothing runs while idle.
Not yet tried on a real deploy. Everything above is tested offline: the bundle CloudFormation ships is built and run against a local store, and the client is run against a local MCP server that checks every request's SigV4 signature. Still to confirm on AWS:
library___<tool> as expected;bedrock-agentcore:InvokeGateway on the gateway ARN is all a worker role needs to call it with SigV4;nodejs22.x Lambda runtime has node:sqlite without a flag (Node 22.13 and later);tracectl mcp unwraps the envelope only when it finds it, and passes
anything else through unchanged).AgentCore runtimes have no GPU. Tools that need one, the Blender renders and the PCB autorouters, run their programs
through runJob (src/gpu/jobs.ts). A job runs on the local machine when that machine has an NVIDIA GPU or the job
does not need one. Otherwise, when TRACE_GPU_QUEUE is set (the stack sets it on each project's worker runtime,
with that project's job definition), the job goes to an AWS Batch queue of GPU instances that scales to zero when
idle. Inputs travel through the central bucket's jobs/<owner>/<repo>/ prefix (TRACE_PROJECT; jobs/_local/ outside
a project), and outputs and logs come back the same way, so the tool answers the same wherever the job ran. The API
runtime has no GPU or CPU queue and runs no tool itself: its tool action is forwarded to the project's worker
runtime (invocation kind tool, src/agents/runtime/tool.ts), which runs it on its clone of the default branch.
A job's spec (its argv, file names and program environment) is written to jobs/<slug>/<id>/spec, and the
container gets only TRACE_GPU_JOB_URI and TRACEPARENT and runs the definition's generic
node /app/dist/gpu/runner.js: AWS Batch's DescribeJobs has no resource-level permission, so anything in a job's
command or environment would be readable by every project. Input names may be relative paths (rtl/sub/x.vh); the
job sees them in that tree, locally and on the queue. A CPU job sent to the queue (remote, or
TRACE_GPU_REMOTE=always) goes to TRACE_CPU_QUEUE with TRACE_CPU_JOB_DEFINITION when the stack sets them, else to
the GPU queue. A job's vcpus hint becomes a VCPU override, capped at TRACE_CPU_JOB_MAX_VCPUS /
TRACE_GPU_JOB_MAX_VCPUS (not applied when the cap is unset).
TRACE_GPU_REMOTE=always|never overrides this choice. The installer's Agents step can turn the queue off and sets
its vCPU limit and Spot use (gpu.enabled, gpu.maxVcpus, gpu.spot in the stack settings). The GPU image is
described in agent/README.md.
CPU jobs. CPU-heavy jobs sent remote (openEMS, and Verilator, formal and nextpnr runs with remote) go to a second
Batch compute environment and queue, <prefix>-cpu, of x86 CPU instances (c7i, c6i and m7i families by default,
on the plain ECS Amazon Linux 2023 AMI), also scaling from 0 vCPUs. They run the same image as the GPU jobs: its CUDA
runtime base starts and runs CPU programs without a GPU, and only the programs that use CUDA load it. Each project has
a CPU job definition, <prefix>-cpu-<hash> (16 vCPUs and 32 GiB by default; with 32 GiB a job needs at least a
c7i.8xlarge or an m7i.4xlarge, so ask 30 GiB to fit a c7i.4xlarge), with the project's own job role, and each
worker is told TRACE_CPU_QUEUE and TRACE_CPU_JOB_DEFINITION (and TRACE_GPU_JOB_MAX_VCPUS and
TRACE_CPU_JOB_MAX_VCPUS, the two definitions' vCPUs, at which a job's vcpus hint is capped) and may submit there only with its own definition and
tag, as on the GPU queue. src/gpu/batch.ts sends a job that needs a GPU to the GPU queue and any other to the CPU
queue. Settings: cpu.enabled (default true), cpu.instanceTypes, cpu.maxVcpus (default 64), cpu.spot,
cpu.vcpus and cpu.memoryMiB, and the installer's CPU fields. The CPU queue shares the GPU side's image, network
and execution role, so it needs gpu.enabled; and it exists only in the nested layout, because a flat stack of 24
projects has no room for one more resource per project.
The GPU image does not hold up the deploy. CloudFormation cannot isolate a failure inside one stack: a failed
resource, a nested stack's included, rolls back the whole update, so putting the GPU side in a nested stack of its own,
or ordering it with dependencies, would still roll back the core with a broken GPU image. So the deploy starts the
GPU image's build (the same custom resource as before, with Wait: 'false') and does not wait for it; no job
definition or project depends on it, and the job definitions name the image tag, which Batch resolves only when a job
starts. The installer then waits for that build as its last step (output GpuImageBuild, the build's id; CodeBuild
BatchGetBuilds), with everything else already installed. If that build failed in an earlier run (an unchanged
source starts no new build), the installer starts it again once (StartBuild, the same tag); if this run's build
fails, it says so, GPU and CPU jobs fail to start until it is fixed, and the next installer run retries it. Building
before the deploy instead was not chosen: the new source reaches S3 only when cdk deploy publishes it, so a build
before it would check the old source. Deploying by hand with cdk deploy, nothing waits for the GPU image: check the
<prefix>-gpu-image build in CodeBuild.
pcb.autoroute routes a KiCad board with up to two routers in turn:
With engine: auto, the tool decides from the board. A board without a complex core, or with no GPU reachable, gets
Freerouting only, and the answer gives the reason. The answer also includes the plan, a report for each stage, the
unrouted count and KiCad's DRC. The tool writes <name>.routed.kicad_pcb and never overwrites the input unless
in_place is set. engine: orthoroute or engine: freerouting re-runs one stage on its own. The thresholds are in
electronics.autoroute.*. To run either router locally, set TRACE_FREEROUTING_JAR (Freerouting needs Java 25,
TRACE_JAVA), TRACE_KICAD_PYTHON (a Python that can import pcbnew), and TRACE_ORTHOROUTE /
TRACE_ORTHOROUTE_PYTHON (its source, and a Python with numpy, scipy, psutil and, for the GPU, cupy).
The Verification agent keeps a project's requirements, test plan and evidence in the project database. The tables are
requirements, test_items, test_results, coverage_points and coverage_hits, and tracectl db merge merges them
like everything else. Requirements, tests and points keep the newer row; results and hits are unioned. New
requirement ids are random (REQ-<6 hex>), so branches do not collide; older ids (REQ-001) are kept. When two
branches still added different requirements under one id, the merge keeps both: theirs is renamed <id>-<6 hex>, its
test items and coverage points follow, and the rename is listed as a merge note (verify.requirements list).
| Tool | What it does |
|---|---|
verify.requirements | Adds, lists and updates requirements: id, text, kind (functional, electrical, timing, emc), acceptance criterion, source and page. extract returns candidate requirements from a spec's text, or from a PDF or text file. It works by rules (requirement verbs, spec-table rows, numeric limits) and never writes; the agent confirms each one with add. |
verify.plan | Test items. Each is linked to requirements, has a method (sim, formal, spice, hil, inspection, drc), and runs as a tool call (its args are checked against the tool's schema) or as a command. Items can also carry measurement limits (expect). |
verify.run | Runs items through their tools or commands and records pass, fail, error or blocked, with the evidence run ids. Hardware tools are blocked unless hardware is allowed. Inspection items take a given verdict. |
verify.coverage | The requirement coverage matrix (verified, coverage_gap, failing, partial, untested, no_test, waived). It merges functional coverage from the evidence runs (cover property points, formal covers, TRACE_COVER <name> lines in any simulator's output) against coverage points, plus line, toggle and branch coverage from Verilator's coverage.dat. |
verify.report | The status as Markdown, kept as an artifact and optionally written to a file. |
verify.verilator | Lint, plus build and run of a C++ or HDL testbench, with line, toggle and user coverage. |
verify.cocotb | cocotb tests on Icarus or Verilator. Per-test verdicts come from results.xml. |
verify.formal | A .sby file through SymbiYosys, or files + top in bmc, prove or cover mode. Without sby it runs yosys and yosys-smtbmc directly (the steps of sby's smtbmc engine). Counterexample traces come back as VCD artifacts. |
Beside the requirements, the project database keeps the design record the agents propose for Define, Architect and
Capture (src/tools/design): intent statements with their source, each requirement's link to the statement it is
derived from, the architectures compared (blocks with their key parts and the requirements each serves, connections,
criteria and scores), the pin plan, and which requirements each schematic sheet serves. It changes with the design, so
it is committed and merged (newer row wins) like the requirements. Agents only propose: accepting intent, striking a
requirement, fixing the criteria, choosing an architecture and agreeing a pin plan are a person's decisions, made in
the guided skills (or design.decide) and kept in the journey record, which agents cannot write.
| Tool | What it does |
|---|---|
design.intent | Intent statements by topic (purpose, environment, power, interfaces, performance, physical, compliance, build, constraints, references): words, source, interface details, numeric limits, "don't care", "unknown, decide by", open questions with an owner, conflicts. Links a requirement to the statements it is derived from. Lists them with people's decisions where the journey is readable. |
design.architecture | Options (one recommended, with why and what it gives up), criteria with weights, a score with a reason per option and criterion, each option's blocks (role, key part numbers, requirements served, place on the diagram) and connections (what flows). |
design.pins | The pin plan: each pin's function, peripheral instance and use, net, reserved role (boot, reset, debug) and the alternate functions the datasheet allows. check compares it with the schematic's netlist through kicad-cli and records the findings as a run. |
design.sheets | Which requirements each schematic sheet serves, and its block (or why it serves none). |
kicad.export keeps the drawings people look at in its run as well as in the output folder: one SVG per schematic
sheet (sheets/<file>.svg), the board SVG and the render, with drawings.json naming the file and sheet each draws
and its page size, so the app can place rule-check findings on them.
HDL sources keep their folder layout in the job (named relative to the deepest folder holding all of them, include
dirs walked into sub-folders, `include directives followed), and include dirs and source folders are passed as
-I/+incdir+, so `include "sub/x.vh" resolves and two sources may share a basename.
The Implementation agent's tools cover two areas:
fpga.synth (yosys for ice40, ecp5, gowin and xilinx; cell counts by resource), fpga.pnr (nextpnr with
PCF, LPF or CST constraints, seed, placer, per-clock targets and floorplan regions), fpga.timing (Fmax against
target per clock, slack, closure status, and critical paths split into logic and routing), fpga.closure (a fixed
sweep of seeds, placers and options that keeps the best attempt) and fpga.bitstream (icepack, ecppack,
gowin_pack).pcb.placement_check (courtyard overlaps on the actual courtyard polygons, an L stays an L, with the
convex hull only when an outline does not close, said so in the finding; parts outside or near the edge, keep-outs, decoupling distance,
connectors off the edge), pcb.length_match (diff pair skew and length groups against given or .kicad_dru
tolerances) and pcb.floorplan (placement by sheet or block: boxes, density, overlaps, nets between blocks). The PCB
tools read the board file and only report; they never move anything.The programs run through runJob as CPU jobs: locally, or on the queue only with TRACE_GPU_REMOTE=always. A missing
program is reported as such. examples/fpga-blinky (iCEBreaker, ULX3S and Tang Nano 9K constraints) is the fixture
that goes from synth to bitstream. examples/sensor-node/logic has a cocotb test (test_moving_average.py) and
formal properties (moving_average_props.sv, moving_average.sby) for its filter.
The Analog/Mixed-Signal agent's tools run ngspice (built and tested against ngspice 42) through the same code as
sim.spice, and record every run:
| Tool | What it does |
|---|---|
ams.spec | Analog specs in the project database (table ams_specs): min/typ/max, unit, conditions and source per spec set and measure. tracectl db merge keeps the newer row. |
ams.corners | PVT corners: .lib sections (tt/ff/ss from the netlist's or electronics.models libraries) or .param sets, × supply values, × temperatures. Returns a table, and per spec the worst corner (least margin). |
ams.montecarlo_yield | Monte Carlo yield against specs, with a Wilson confidence interval, and per measure a sensitivity ranking (correlation over the runs, and/or one-at-a-time ±tol runs). |
ams.opamp_check | Generated benches around a subcircuit: loop gain by Middlebrook double injection (crossover, phase and gain margin), Aol/GBW, CMRR, PSRR±, slew, output swing, input common-mode range. |
ams.noise | .noise integrated over a band, output and input-referred, spot densities, and the top contributing devices. |
ams.mixed | One ngspice transient with the analog netlist, an ideal behavioural ADC and a Verilog design compiled by Verilator into a d_cosim library. Without Verilator it runs the analog part only and says so. |
ams.mixed reproduces ngspice's vlnggen steps itself, with ngspice's own shim sources. It gives every input bit
its own port, because ngspice 42's shim mis-clears bits of multi-bit inputs. It also keeps the library path lower
case, because ngspice lower-cases the netlist. The co-simulation is two-state and cycle-based: Verilog # delays
are not simulated. For the sensor-node front end driving moving_average.v, the averages match the latched ADC codes
sample for sample (test/tools/ams).
The EMC/Simulation agent's tools:
| Tool | What it does |
|---|---|
emc.spectrum | Closed forms: trapezoid harmonics and envelope (Paul), differential-mode loop and common-mode cable radiation (Ott), and the cable current that meets a limit, against CISPR 32 class A/B. |
emc.precheck | Rules on the board's geometry with no solver. It checks return-path gaps and plane-split crossings, switching-node area, fast nets near the edge, missing stitching vias, decoupling distance, and an edge-rate emission estimate. Each finding has a location and its evidence. |
emc.setup | An openEMS FDTD model of a board region: copper, stackup, lumped/MSL ports, PML or MUR at a reported margin, graded mesh, optional NF2FF. It is written as one deterministic Python script, with cell count, memory and time estimates. |
emc.run | Runs the model through runJob (kind openems). It goes to the Batch queue when TRACE_GPU_QUEUE is set and the model has more cells than TRACE_OPENEMS_LOCAL_MAX_CELLS (2e6). Returns a Touchstone file, IL/RL, a TDR impedance profile, and a far-field dBuV/m pre-compliance estimate against CISPR 32. |
emc.si | scikit-rf checks on S-parameters: TDR discontinuities, insertion loss against a budget, and NEXT/FEXT between nets. |
Every radiated figure is labelled as a pre-compliance estimate. Locally, openEMS needs its Python modules
(TRACE_OPENEMS_PYTHON, or openems-python on PATH) and scikit-rf (TRACE_PYTHON). The GPU image builds openEMS
v0.37.0 and installs scikit-rf 2.2.0.
src/tools/protocol simulates digital buses, checks them against datasheets and the bus standards, and draws their
timing. It builds on what is there: the models write VCDs that sim.wave_read, sim.wave_decode, sim.wave_timing
and verify.* read; the analog layer runs through sim.spice; datasheet figures come from the shared library through
datasheets.params; captures come through hil.scope_capture and hil.scpi; testbenches run in sim.logic.
| Tool | What it does |
|---|---|
protocol.model | Bus-functional models: transactions in, edges out (model.vcd, model.csv; RS-232 line voltages as line.csv), every time configurable. I2C standard, fast, fast-plus and high-speed (master code at Fast-mode timing, then Hs), 7- and 10-bit addresses, read, write, combined (repeated START), ACK/NACK, clock stretching, two-master arbitration (wired-AND, the loser releases SDA), general call. SPI modes 0-3, MSB/LSB first, 1-32-bit words, several selects, daisy chains (each device's output shown), dual and quad lanes, tCSS / tCSH / tCSD, inter-word gaps, the responder's tV and tHO (MISO x between them). UART/RS-232 baud, 5-9 data bits, parity (even, odd, mark, space), 1/1.5/2 stop bits, break, inverted logic, a transmitter clock error, and the RS-232 driver voltage (mark negative). CAN 2.0A/B with stuffing, CRC-15, the ACK slot and bit timing from the clock, sample point and SJW. 1-Wire reset/presence and slots at standard and overdrive speed. I2S in I2S and left-justified formats. Each run decodes its own waveform and reports whether it gets the transactions back. |
protocol.bus_analog | The physical bus as a SPICE netlist, run with sim.spice: open drain (Rp, Cb, Ron = VOL/IOL), push-pull (driver resistance and edge, the trace as RC or a transmission line, ideal or lossy LTRA, from calc.impedance and kicad.net_length when a board net is given, receiver capacitance), RS-232 (levels, slew, cable, 3-7 kΩ load). It measures, per edge at the receiver, rise and fall time (30-70 % for I2C as UM10204 defines them, 10-90 % otherwise), overshoot, undershoot, settling, levels, and the delay to VIH / VIL. Those delays are the effective timing protocol.check applies to a digital capture (analog_runs). |
protocol.pullup | The I2C pull-up range from UM10204 section 7.1: Rp(min) = (VDD - VOL) / IOL, Rp(max) = tr / (0.8473 Cb). calc.i2c_pullup does the arithmetic. With simulate, it runs the pick through protocol.bus_analog. |
protocol.spec | Device interface timing in the project database. For I2C: fSCL, tHD;STA, tLOW, tHIGH, tSU;STA, tHD;DAT, tSU;DAT, tVD;DAT, tSU;STO, tBUF, tr, tf, Cb, tSP and levels. For SPI: fSCK, SCK high/low, tCSS, tCSH, tCSD, tSU, tH, tV, tHO, tDIS, the modes and word sizes. For UART: baud and tolerance. Each parameter has min/typ/max in the unit given (stored as SI), conditions, and a citation. A citation is verified: true only when it has the part, sha256 and page. |
protocol.spec_extract | Proposes specs from a datasheet in the shared library, by rules, with no model inside. Each characteristics-table row is matched on its normalised symbol (tSU;DAT, t SU:STA and tSU(DAT) are one symbol), then on its parameter name. A symbol that belongs to another protocol is skipped. Numbers are converted to SI, and each candidate carries its page citation. Rows whose cells are not plain numbers come back raw. It never writes: the agent confirms each row with protocol.spec. |
protocol.check | Judges a capture against a device spec, the standard (UM10204 speed modes; 1-Wire standard or overdrive; the derived mid-bit tolerance for UART), or inline limits. For each parameter it reports the measured worst case, the limit, the margin, pass/fail, the two edges and the transaction where the worst case happened, and SPI mode compatibility. It is recorded as a protocol.check run with a measurement per parameter and margin, so trends show over commits, and verify.run can take it as a test item. |
protocol.compat | The initiator-to-responder budget from two specs, at corners (slow, fast, and the worst mix). SPI covers write and read setup/hold, the read-path fmax, fSCK, SCK high/low, tCSS/tCSH/tCSD and shared modes. I2C covers each generated time against the responder's minimum, fSCL, and tLOW - tr - tVD;DAT - tSU;DAT. Flight time comes from the delays you give, or from lengths or board nets. A missing figure is listed, and its check is skipped. |
protocol.diagram | Timing diagrams of a capture or a spec, or both stacked. They show signal lanes, bus lanes with values, decoded rows (START, ADDR 0x50 W, ACK, DATA, ...), measurement arrows from a check (green pass, red fail), cursors, and zoom to a window or a transaction. The SVG is written in TypeScript. A PNG is made when resvg, rsvg-convert or sharp is installed; otherwise it is skipped and the result says so. WaveDrom JSON comes back as text, sampled on a tick. Spec mode draws the datasheet timing at the spec's limits. |
protocol.capture | A real bus to VCD: sigrok-cli with a logic analyser (fx2lafw by default; not installed by trace), hil.scope_capture channels digitised at a threshold, or an oscilloscope's digital channels over hil.scpi (Rigol MSO5000-style commands by default). With protocol, it then checks the capture like protocol.check. Hardware only. |
protocol.testbench | A self-checking Verilog testbench from a model: the initiator's signals are replayed into the DUT edge for edge, and e |
| Qty | Value | Footprint | References |
|---|---|---|---|
| 1 | 100n | Capacitor_SMD:C_0603_1608Metric | C2 |
| 1 | 10n | Capacitor_SMD:C_0603_1608Metric | C1 |
| 1 | 13k | Resistor_SMD:R_0603_1608Metric | R2 |
| 1 | 39k | Resistor_SMD:R_0603_1608Metric | R1 |
| 1 | 680 | Resistor_SMD:R_0603_1608Metric | R4 |
| 1 | 6k2 | Resistor_SMD:R_0603_1608Metric | R3 |
| 1 | BAT54S | Package_TO_SOT_SMD:SOT-23 | D1 |
| 1 | MCU | Connector_PinHeader_2.54mm:PinHeader_1x04_P2.54mm_Vertical | J2 |
| 1 | RED | LED_SMD:LED_0603_1608Metric | D2 |
| 1 | SENSOR_IN | Connector_PinHeader_2.54mm:PinHeader_1x02_P2.54mm_Vertical | J1 |
It measures 40 × 25 mm and has 2 copper layers, 1.6 mm thick.
10 parts, built around the CC0603KRX7R9BB104, BAT54S-7-F-79, PZ254V-11-04P and KT-0603R. The full list of its parts is on this page, with links to each part's symbol and footprint where PCBKit's library has them.
From the mteichtahl/trace repository on GitHub, at the commit this page was made from: the board is examples/sensor-node/hardware/sensor-node.kicad_pcb and its schematic examples/sensor-node/hardware/sensor-node.kicad_sch. PCBKit opens the board in the browser, with nothing to install.
Its repository states no licence, so its author keeps all rights: ask mteichtahl before reusing the design.
mteichtahl/trace
trace runs a repository by itself and gives Claude the tools to do electronics work in it. It is generalised from the loop that runs Potroller.

mteichtahl/trace
trace runs a repository by itself and gives Claude the tools to do electronics work in it. It is generalised from the loop that runs Potroller.

jiazhengfu912-lang/STM32-Isolated-RS485-DevBoard
STM32F103C8T6 isolated RS485 development board: KiCad schematic, PCB, 3D previews and engineering validation


actuallysparky/bearamin
Bear-sized optical gesture instrument firmware.

jamro/tiny-engineer
A small desktop robot that brings an AI coding assistant to life, physically acting out when it reads files, thinks, writes code, and finishes work.

enkhbold470/kicad-projects
Five KiCad 10 boards (4- and 6-layer): ESP32-S3 industrial gateway, USB-C PD bench supply, RP2040 logic analyzer, FOC motor controller, iCE40 FPGA board.

enkhbold470/pd-brick
USB-C Power Delivery bench supply: STUSB4500 sink, LM5176 buck-boost, INA228 monitor, 1.2-22 V set over I2C by an ESP32-S3. 4-layer KiCad 10 board.

tomrodinger/servomotor
Open-source NEMA-17 integrated servomotor (motor + closed-loop driver + controller + encoder). RS-485, Python/Arduino libraries, MCP server for AI control. Hardware, firmware and software.
