2 layers101.6 × 53.3 mm
BatteryAnalyzer MkII
Moragor/BatteryAnalyzer_MkII
Updated Version of the battery analyzer, now with constant current
25 parts12MIT

 JohnRipple/turbine-sensor
After taking a look at the kit it was lacking content. It could be built in about 10 minutes. With a 45 minute time slot for each class there was a lot of time to fill, so I decided to make a more interesting turbine…
Turbine is an open-source printed circuit board by JohnRipple, from the JohnRipple/turbine-sensor repository on GitHub. It is a 2-layer board of 130 × 44.4 mm with 10 parts on 47 nets, routed with 76 tracks and 0 vias.
It is built around the MCP3008-I/P and TLV2372IP. Its parts include 4 resistors, 4 connectors and 2 ICs.


In May 2025 Keysight had an tour day for the local middle school. This included live demonstrations, presentations, and activities for the kids. One of the activities we had planned was for them to build a wind turbine kit.
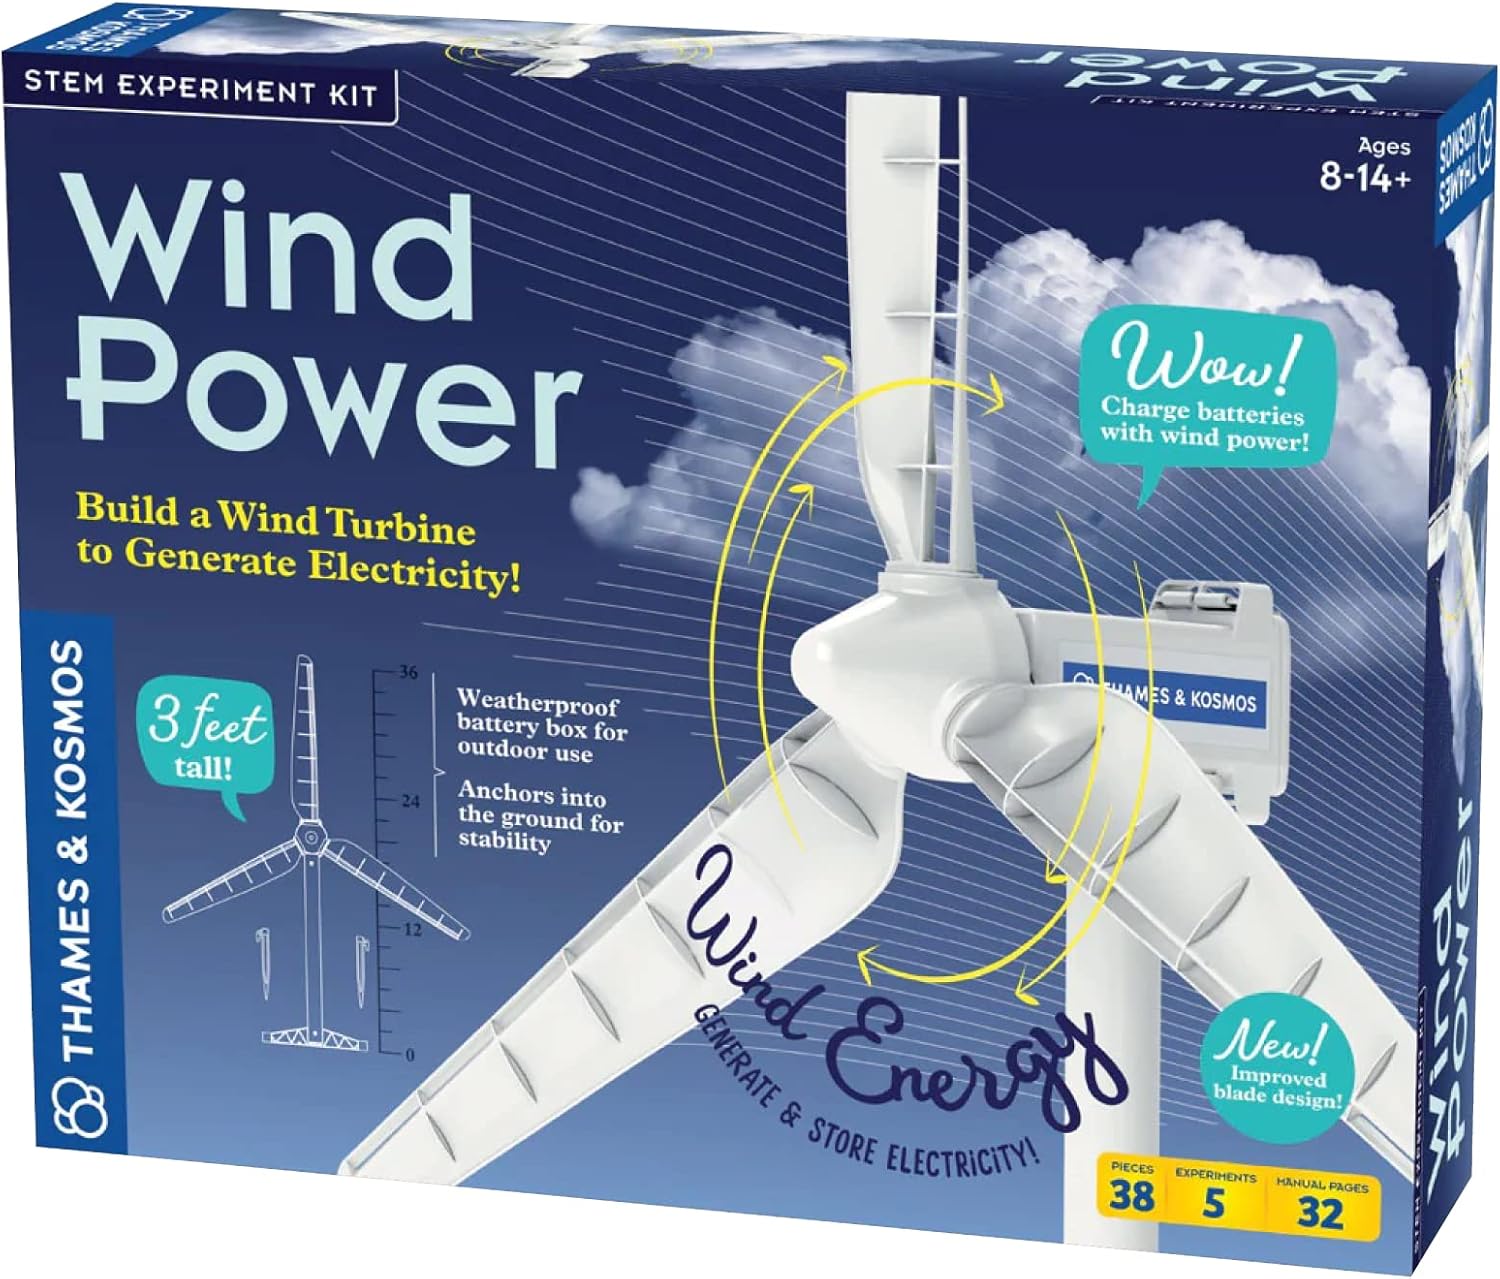
After taking a look at the kit it was lacking content. It could be built in about 10 minutes. With a 45 minute time slot for each class there was a lot of time to fill, so I decided to make a more interesting turbine with some extra sensors to categorize what the turbine is doing.
I knew I wanted to measure the speed the turbine rotated and the power it generated. The kit included a rechargeable battery with a button to reverse the motor to either use the battery power or generate power from the turbine moving. With both the rotations per minute and the power generated I could then figure out how long it would take to charge the battery.
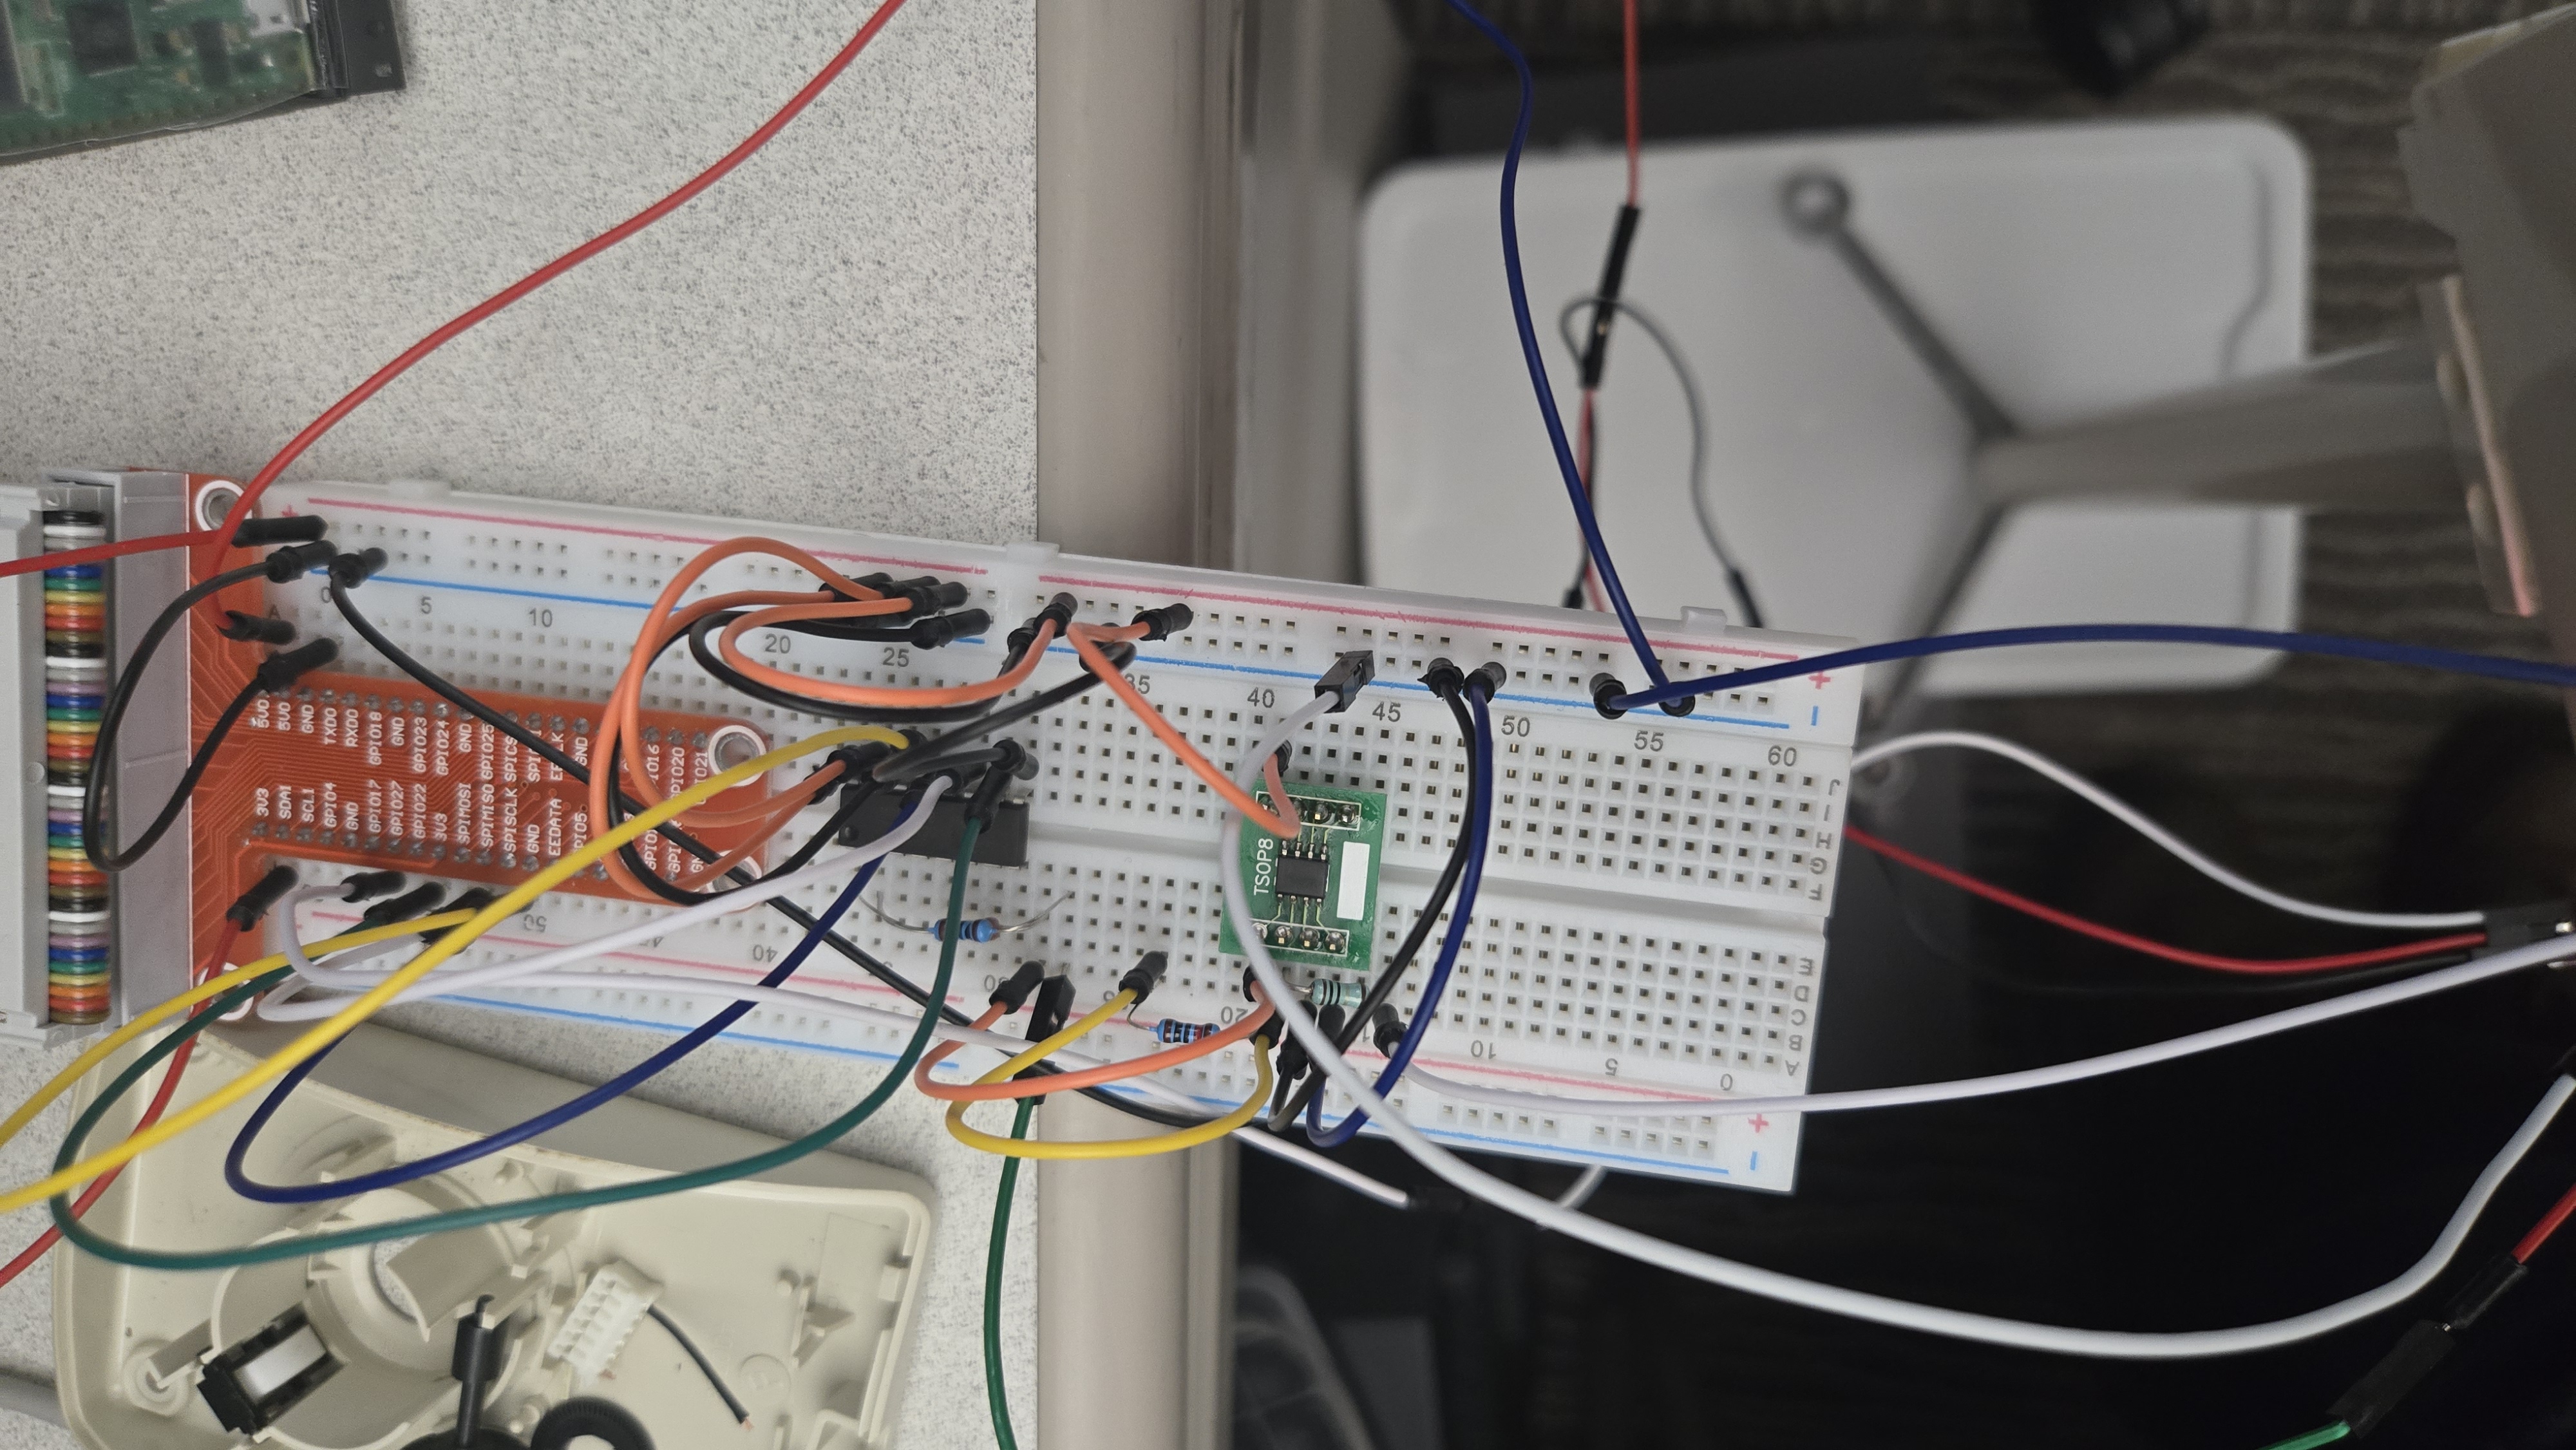
I started bread boarding the circuit using a Raspberry Pi that I had laying around. I had two ideas to measure the turbine rotation speed; either a hall effect sensor or a encoder.
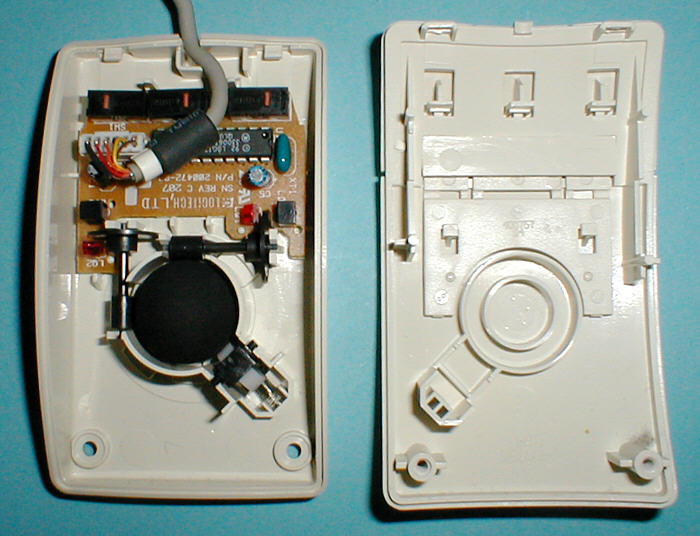
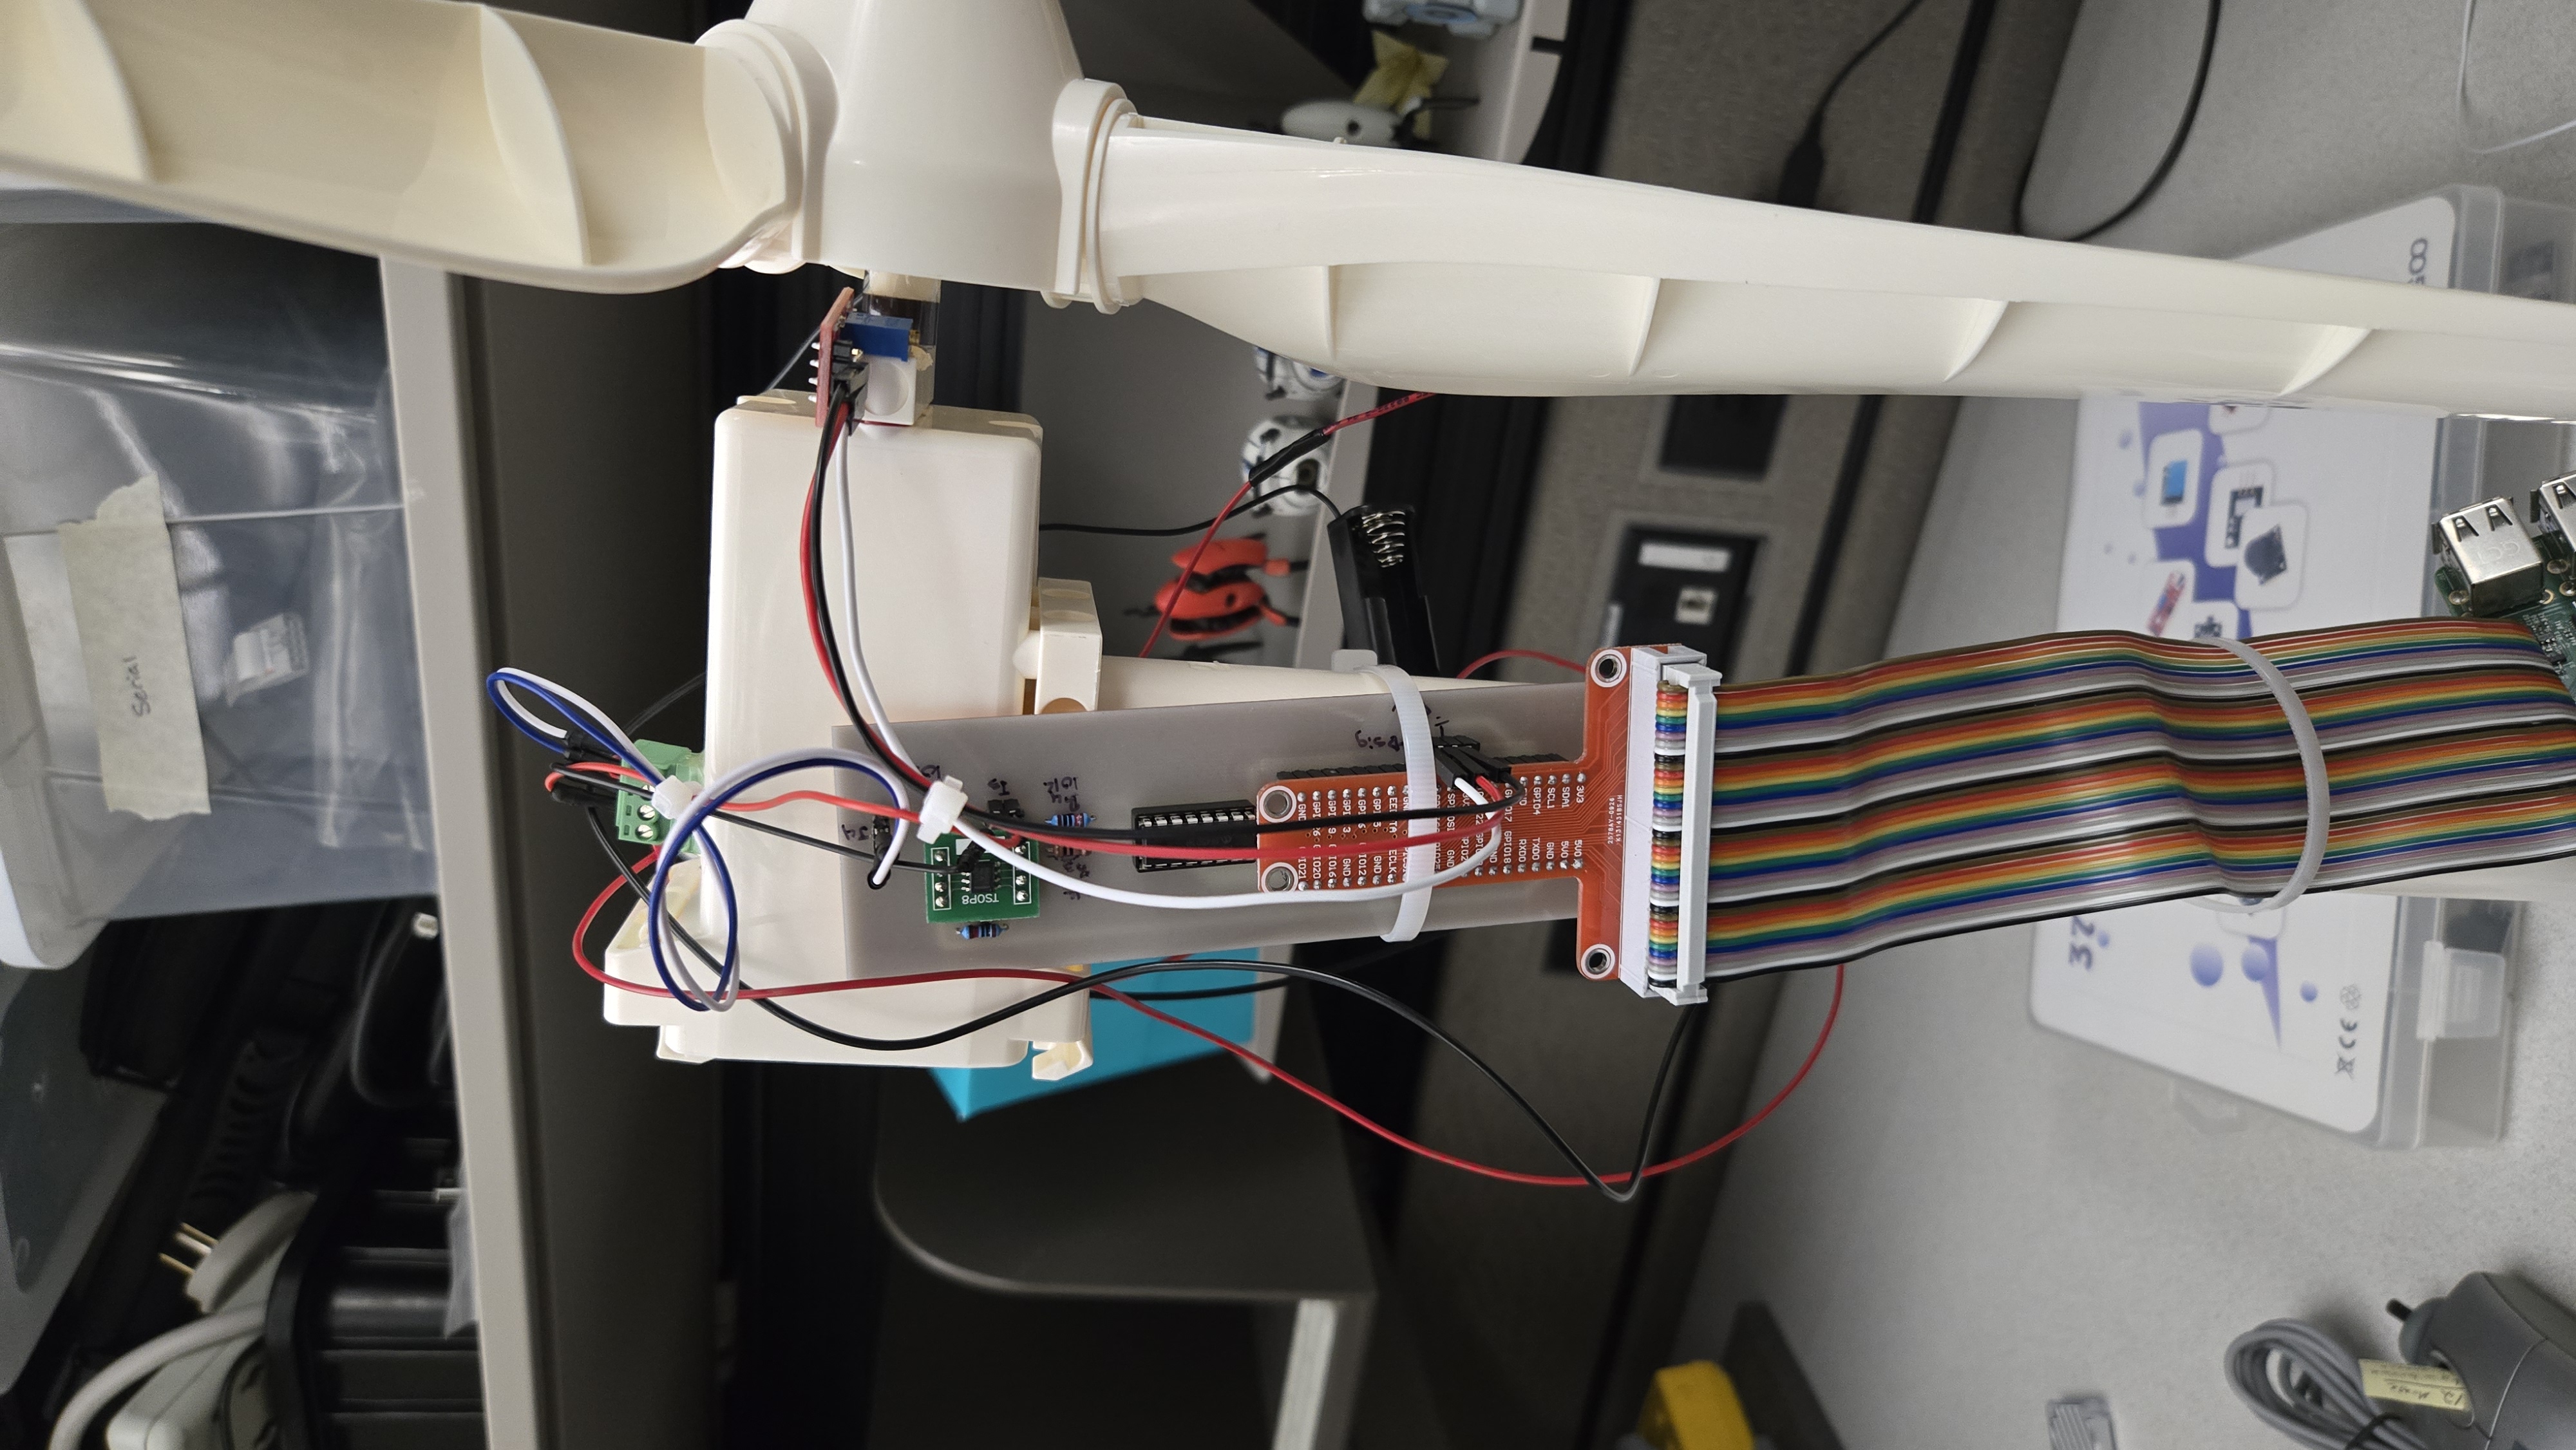
While looking through the recycling at Keysight I found a Logitech MS30 mouse from the 90s with a trackball. The older mice with trackballs worked by using two encoders to measure the ball's movement in the X and Y directions. These encoders would have been more than good enough to track a slow moving turbine. I dismantled the mouse and took out the encoder wheel and the circuit board. After drilling the encoder wheel center out so it fit on the turbine and hooked up a cheap beam break sensor. Unfortunately, the encoder wheel slits were too fine for the beam break sensor. With that in mind I tried, unsuccessfully, to get the original circuit board for the mouse to work with the Raspberry Pi. I soldered wires to each side of the beam break sensor on the mouse and tried to measure voltage changes across the light sensor and the emitter, but it seemed like the mouse was dead. After realizing this was getting to be a time sync I moved on to the hall sensor.
The idea behind the hall sensor was to pair it with a strip from a fridge magnet. Fridge magnets work well for this because they have multiple vertical strips of magnets running throughout.
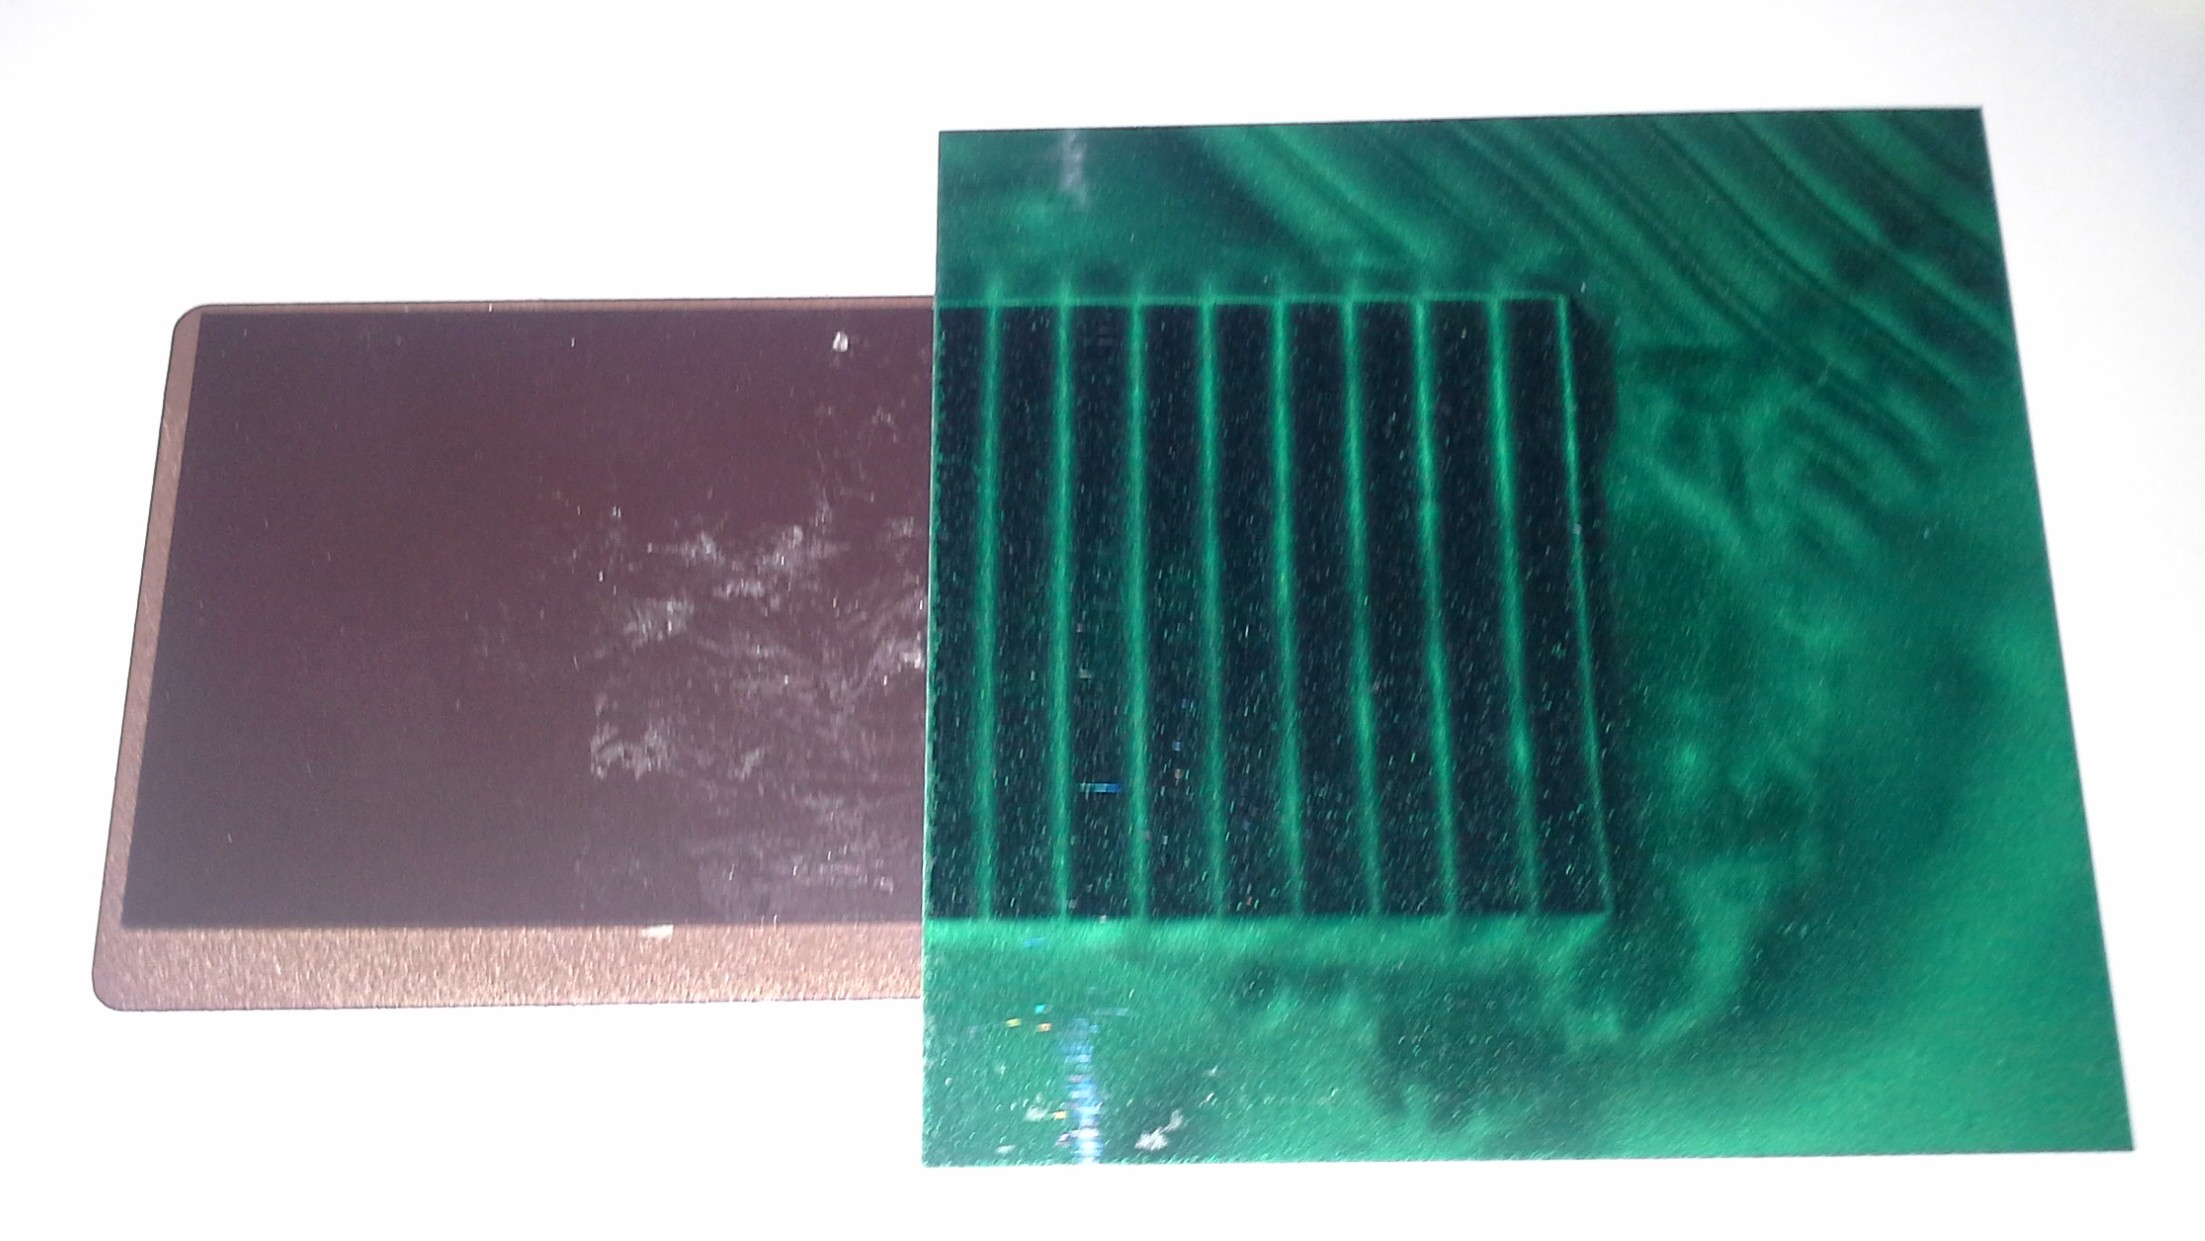
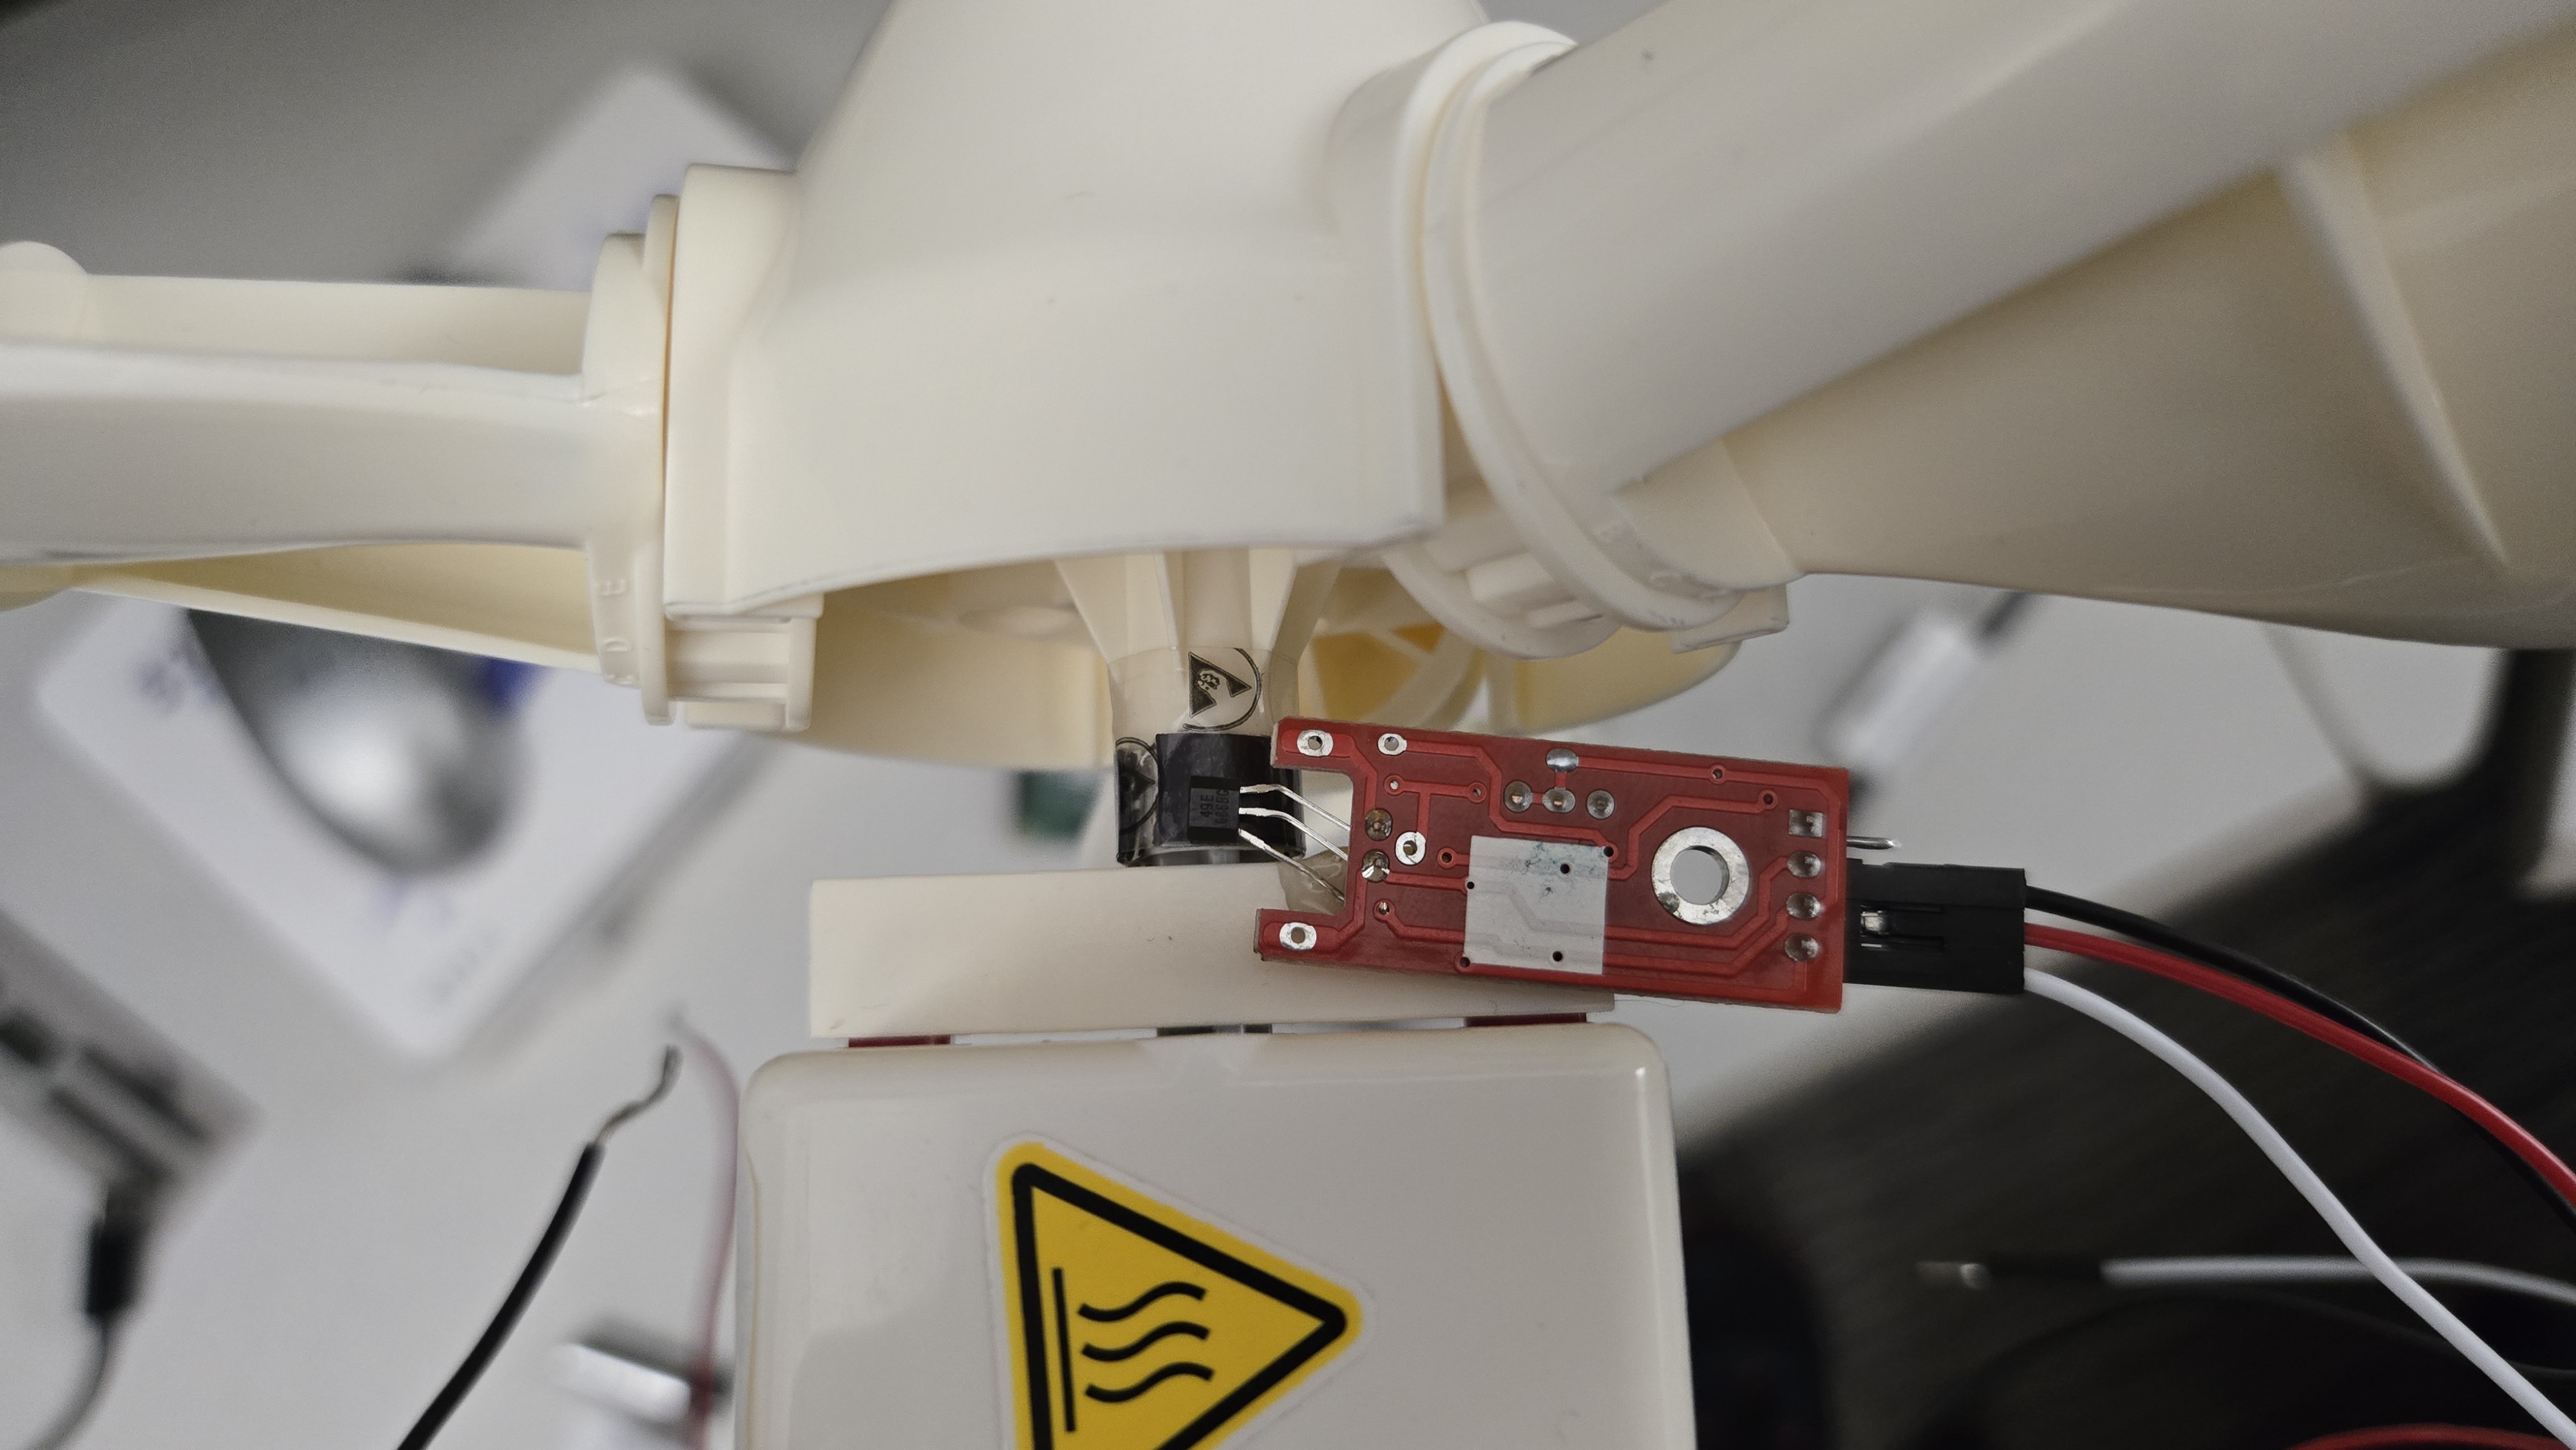
After cutting a strip off the top of the fridge magnet it could be easily glued to the center shaft of the turbine. This mixed with a linear hall sensor with a digital output made it easy to hook up to the Pi and get some data out. From there it was just measuring how many strips from the fridge magnet made a full rotation in order to calculate rotations per second for the turbine.
To get the power calculation I had to modify the turbine itself. The idea was to put wires at the top and bottom the battery slot in the turbine to get overall voltage and then add an inline resistor with a known 0.1 ohm resistance that the voltage could be measured across to calculate the current through the resistor and the circuit as a whole. With the overall current and voltage for the turbine the power could be calculated with P=VI.
To make use of all the analog voltages I was measuring I added an MPC3008 ADC to convert to digital outputs since Raspberry Pi's don't have ADCs on the GPIO ports. I then realized that the voltage across the 0.1 ohm resistor was about 2 mV when the ADC had a minimum input value of 0.2 V. I went to the lab stock and found the op amp with the largest quantity and soldered it to a board to convert it from a soic package to a bread board size.
After hooking all that up it worked for a little bit until it fried some of the gpios. I then added some resistors in between the ADC output and the Pi to stop any power spikes from destroying more gpios and then I had a working circuit.
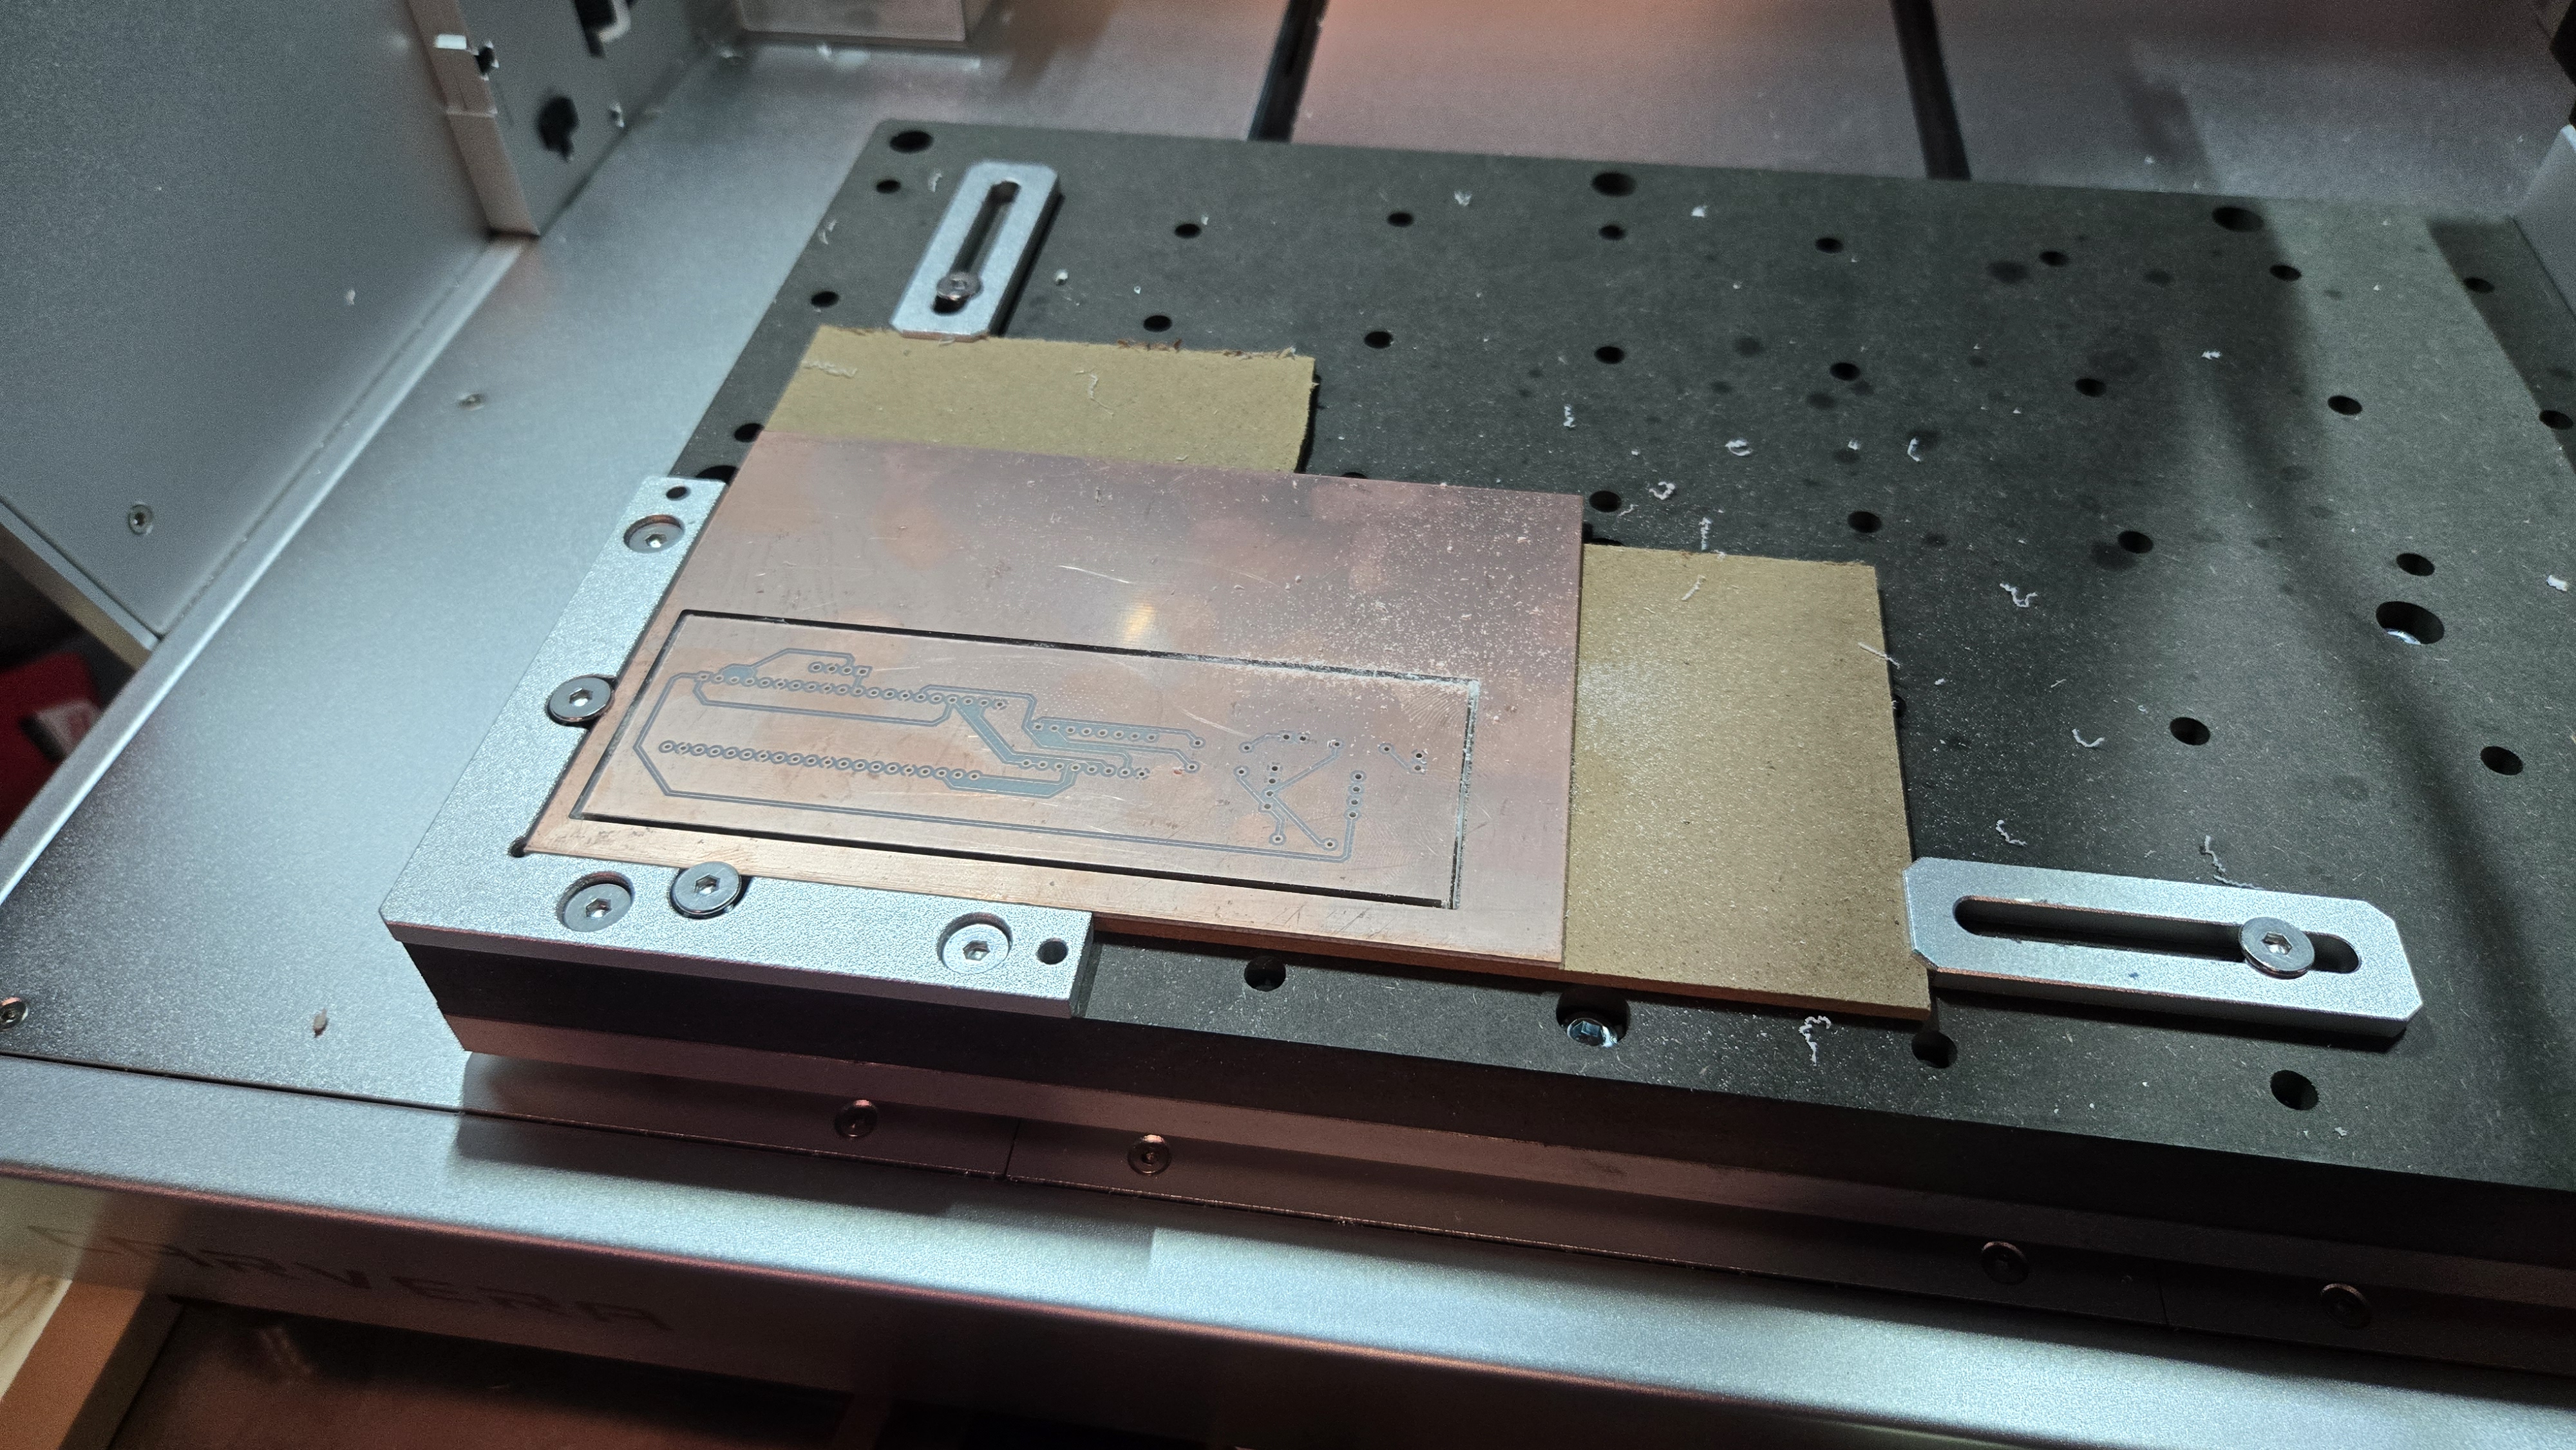
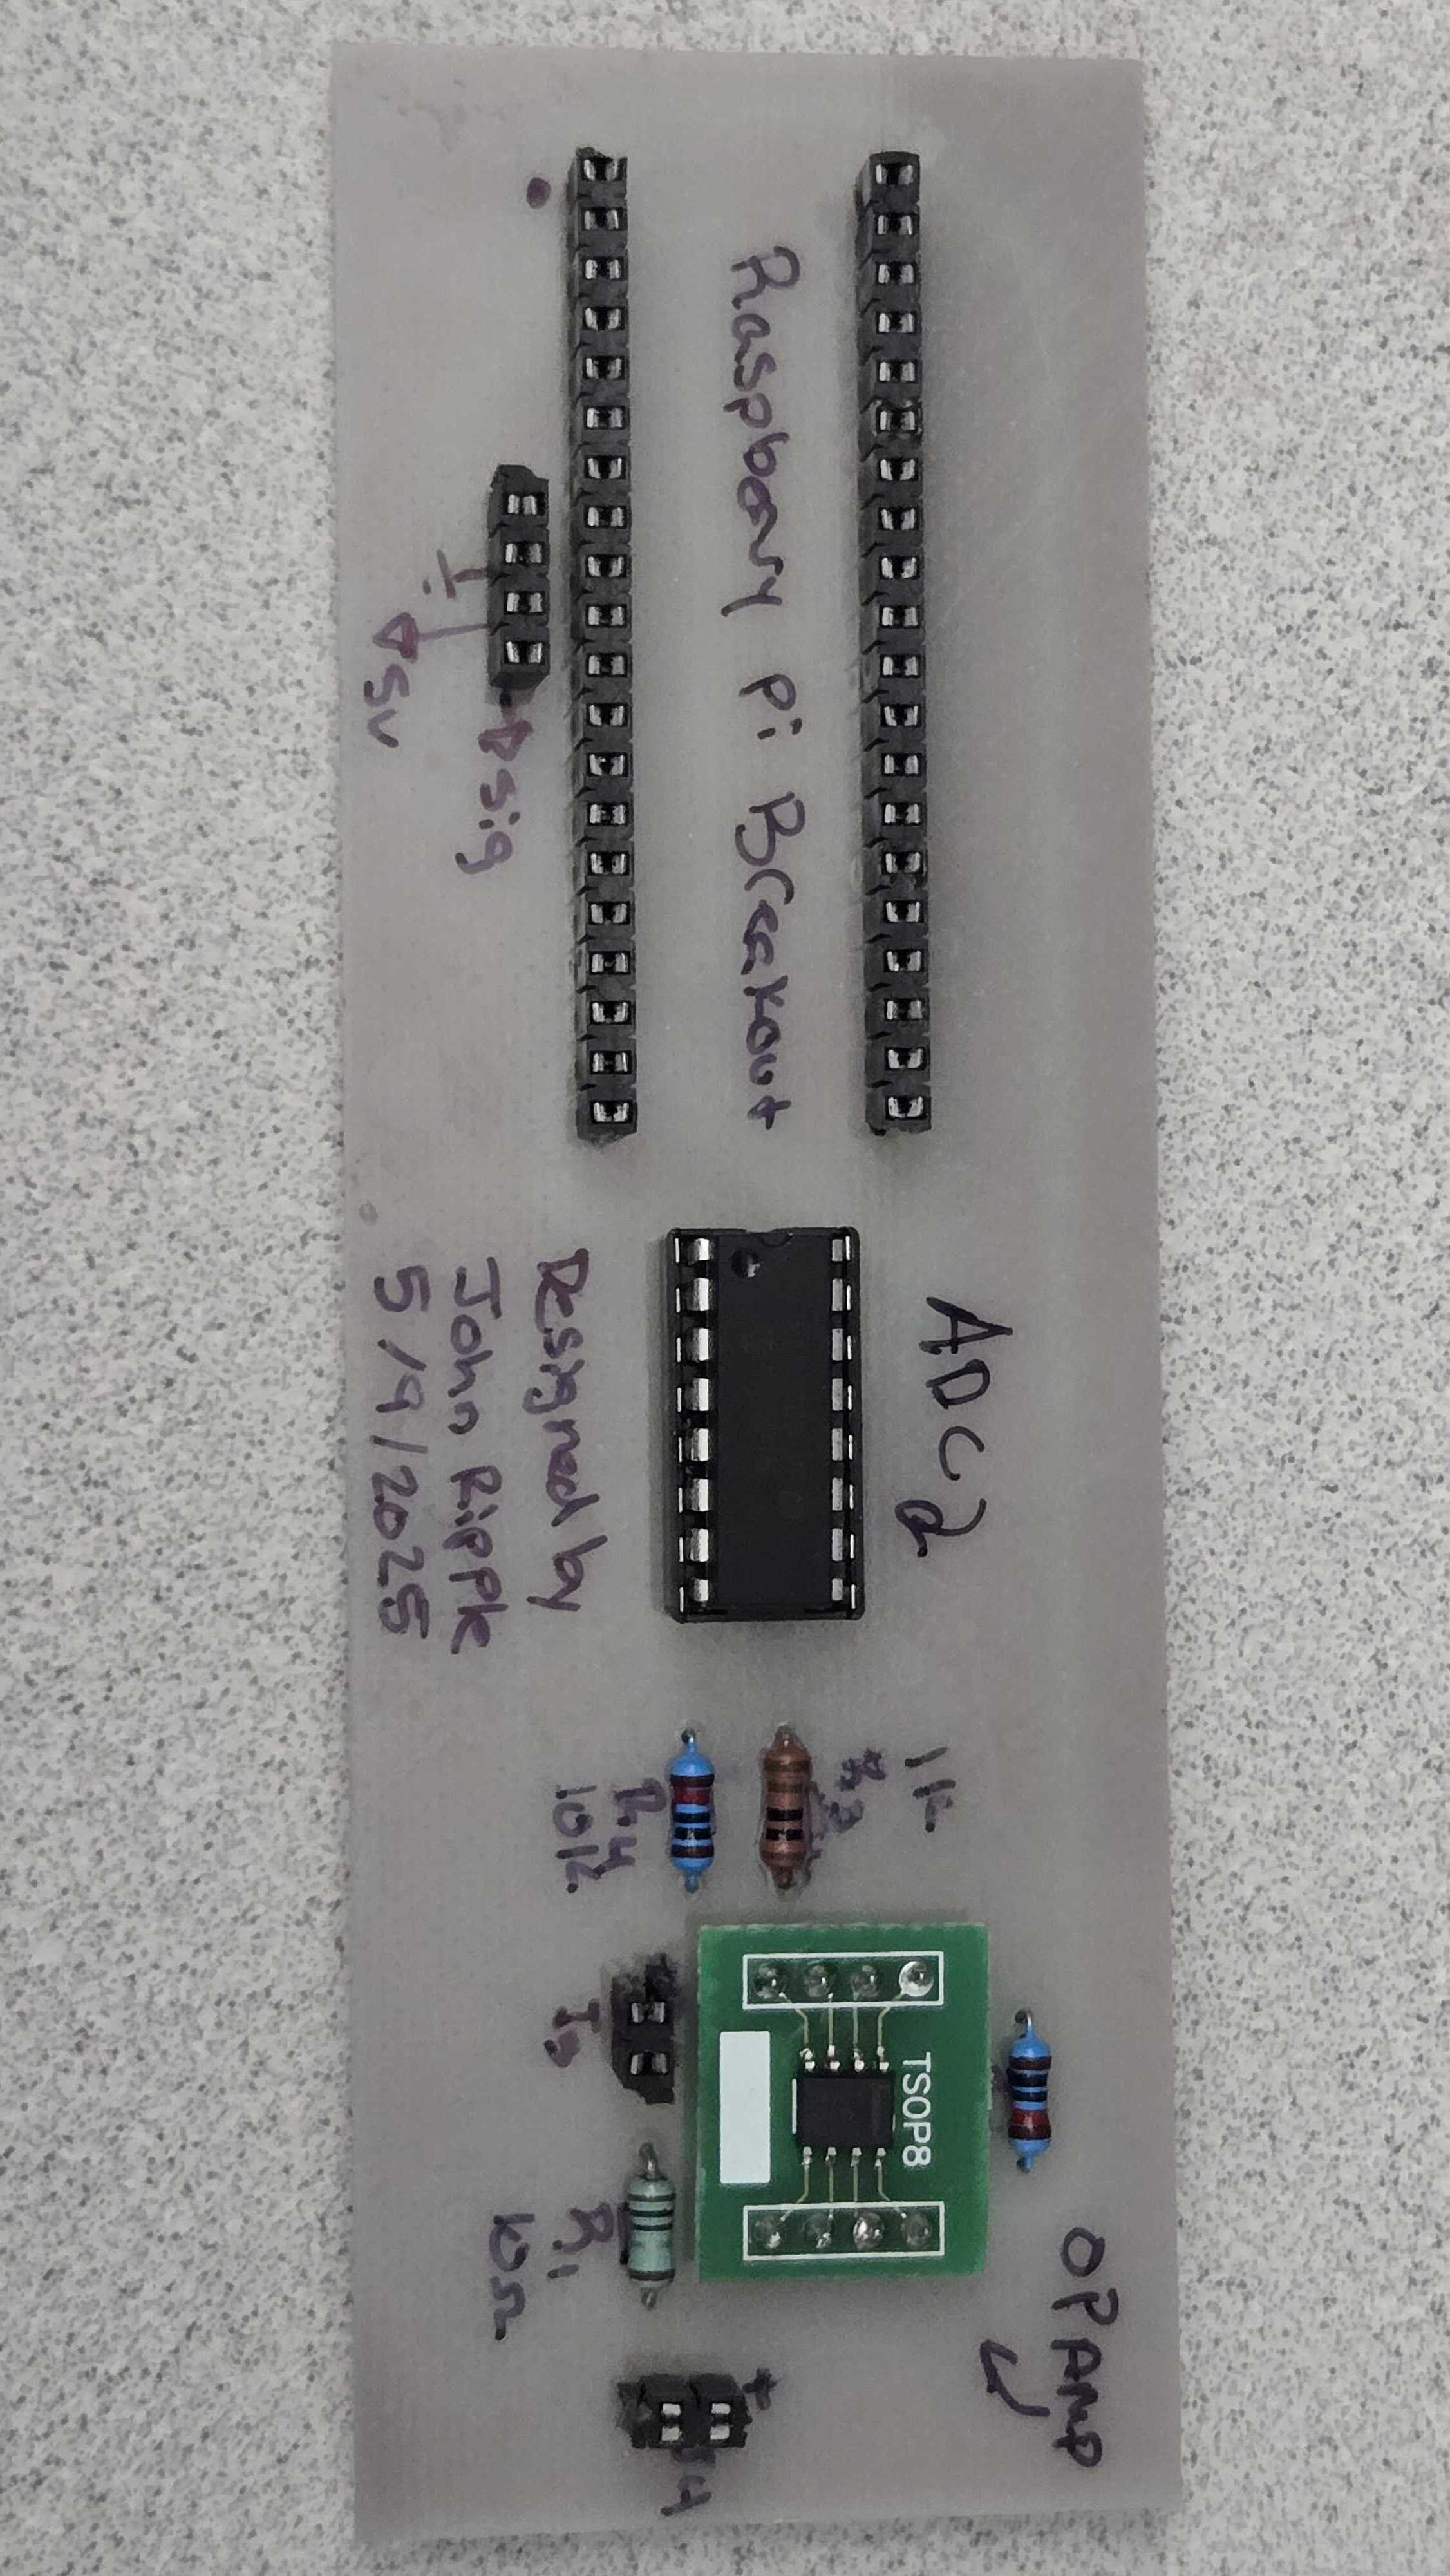
The PCB design was basically taking the bread board circuit and translating it into KiCAD. I started with a circuit design where I had to make some custom symbols for the components and some custom foot prints for the component sizes. From there I made the board layout as a single layer of copper with all the traces easily visible. I used a CNC machine to mill out the single sided circuit and then soldered all the components onto the pcb and plugged it in only for the Pi to immediately shutdown.
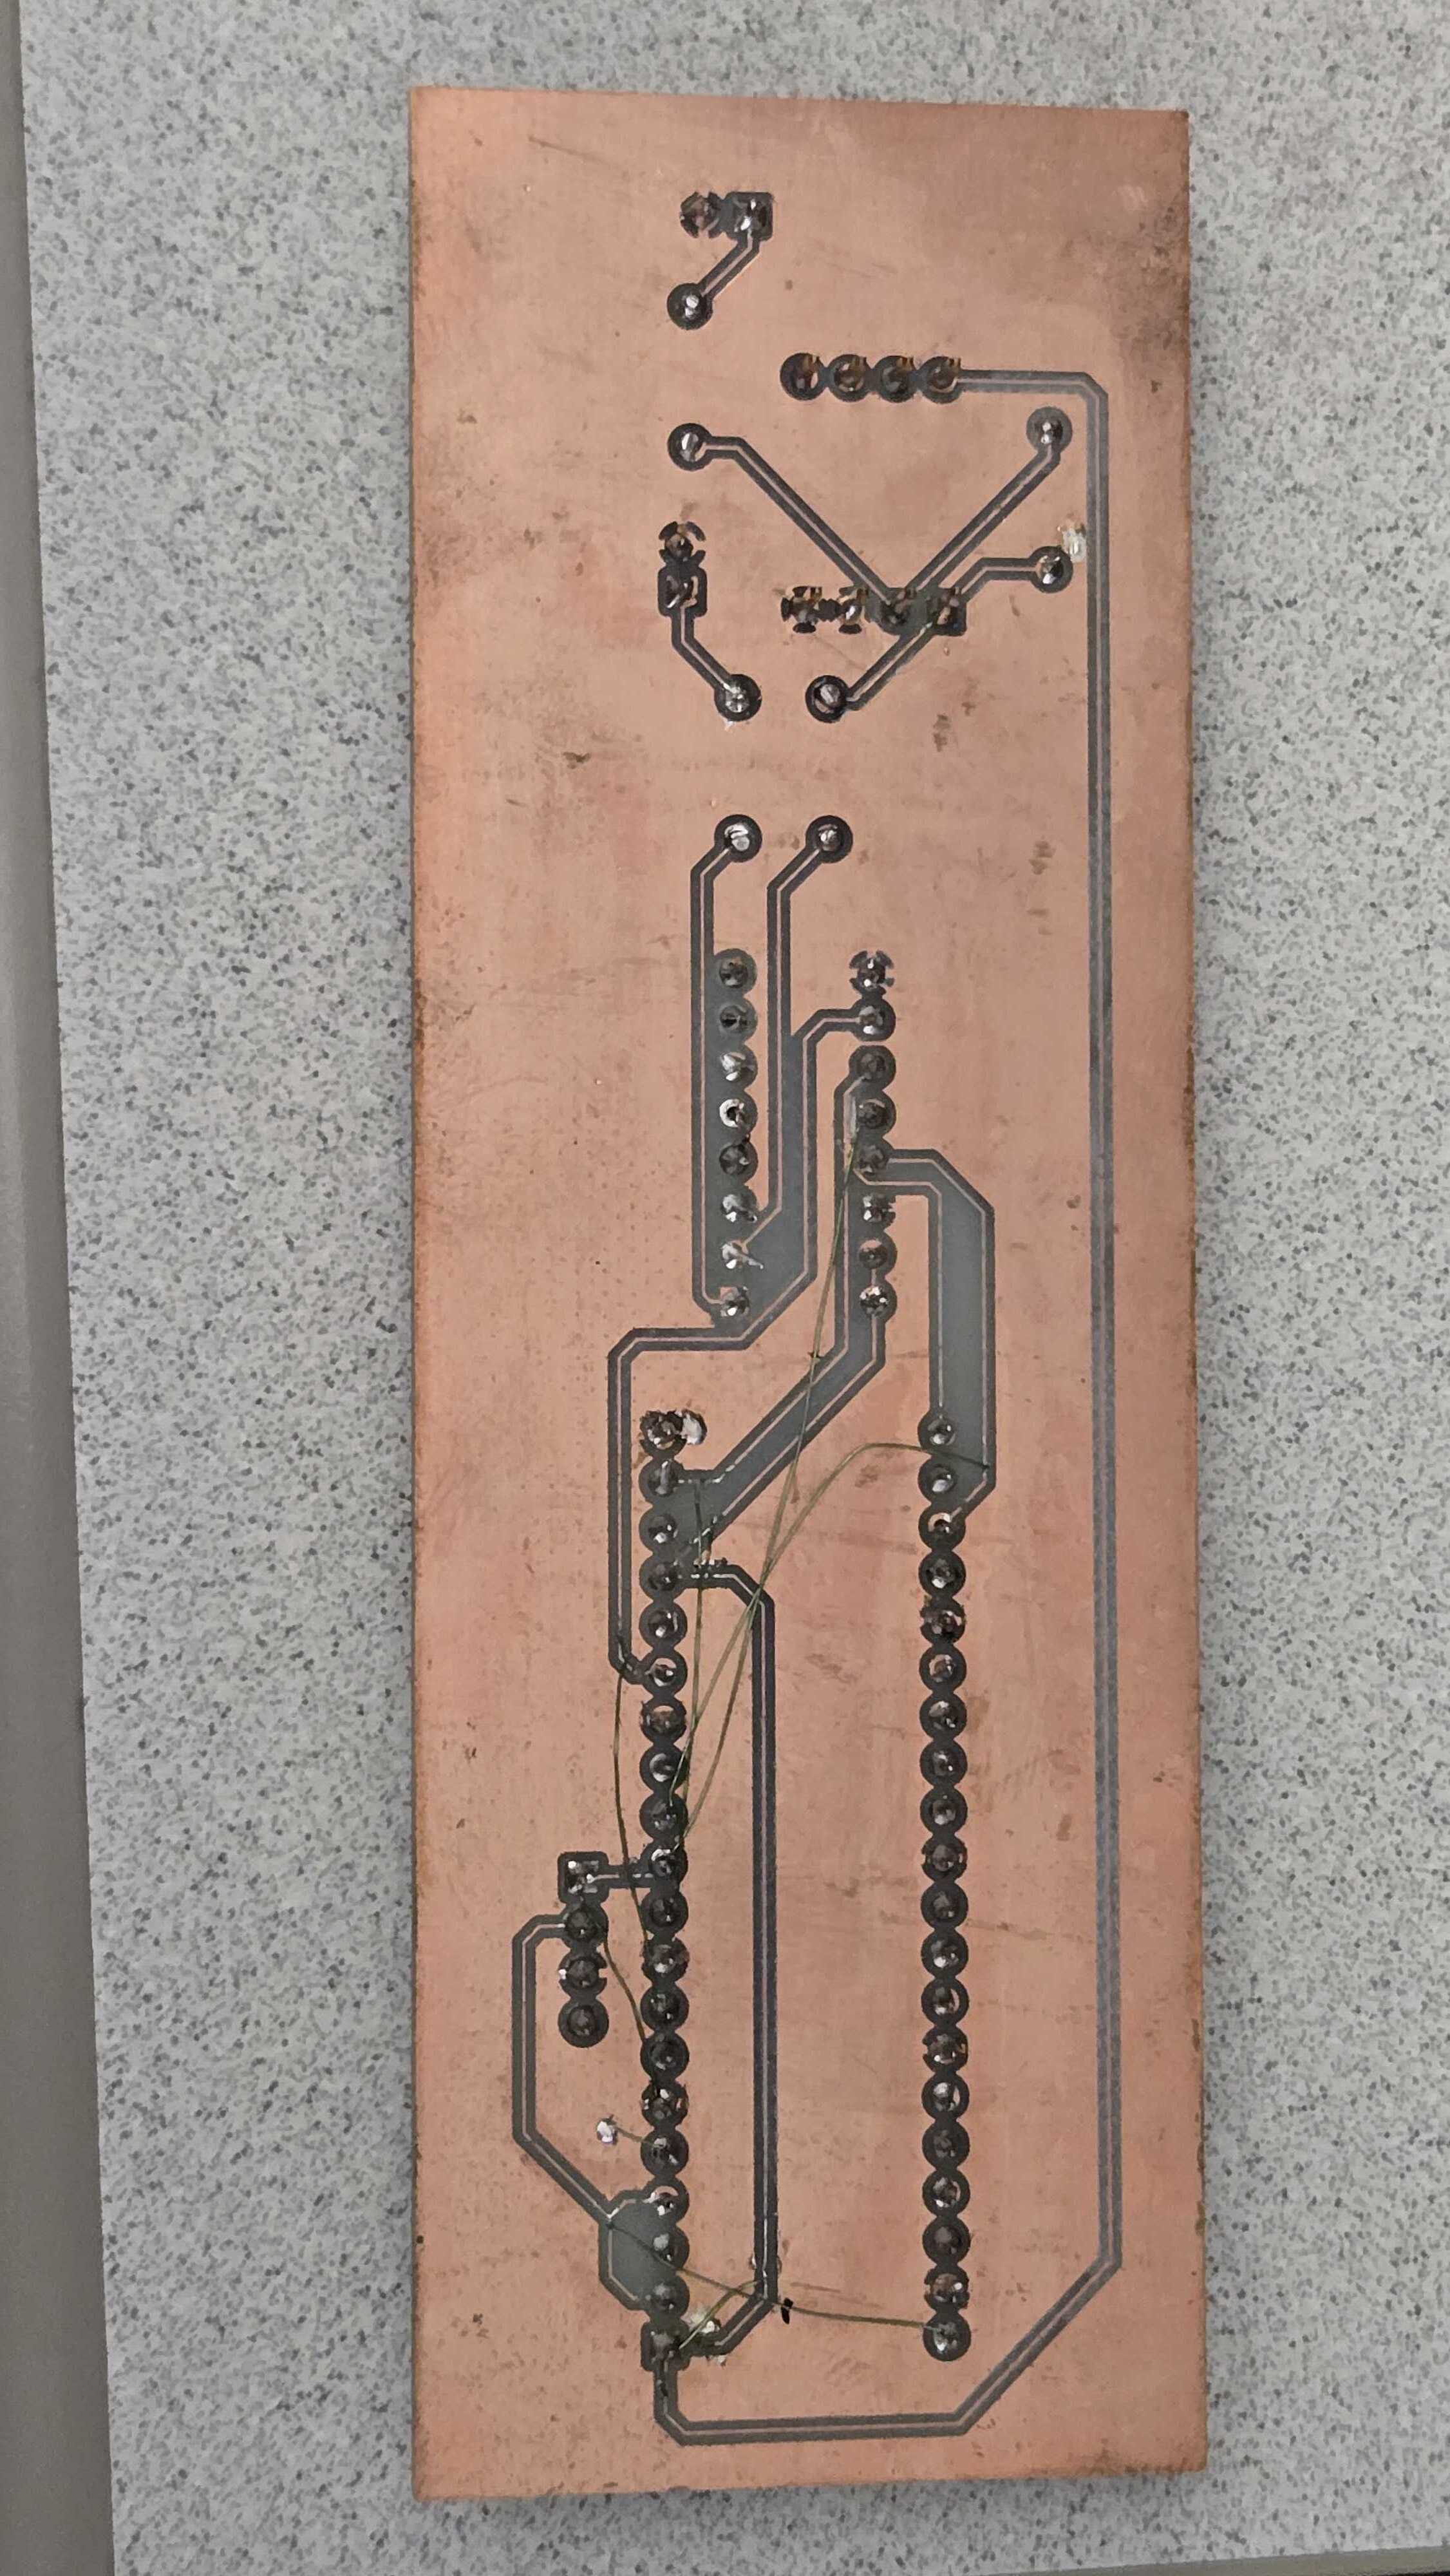
It was at this point I noticed the footprint for the Pi expander board was incorrect in KiCad. Instead of numbering the board with all even numbers on one side and odds on the other (which is common for bread boarded parts), the KiCad profile instead had the numbers increase in a circle which is more common on PCB components. i.e. The left side of the expander was 1, 2, 3... instead of 1, 3, 5...
This meant I had to go through with an exacto knife and cut all the traces from the Pi expander board to the other components and kludge in my own wires.
After that the PCB worked great!
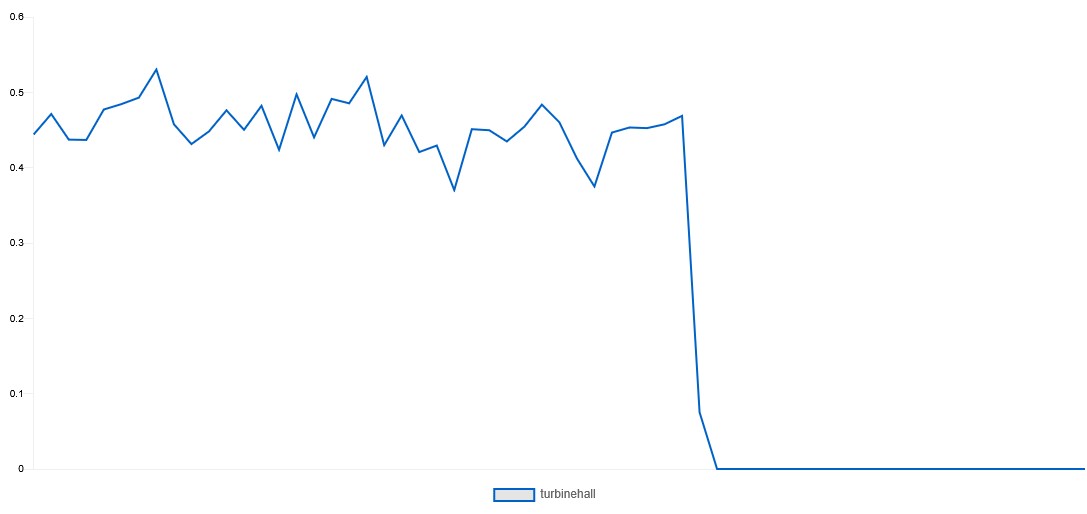
I decided to use Adafruit IO to display the data since it had an easy to use API for python and made nice graphs. Unfortunately, for some reason, Adafruit IO would let you set the axis values for the graph but would never display them. The following graph is the rotations per second.
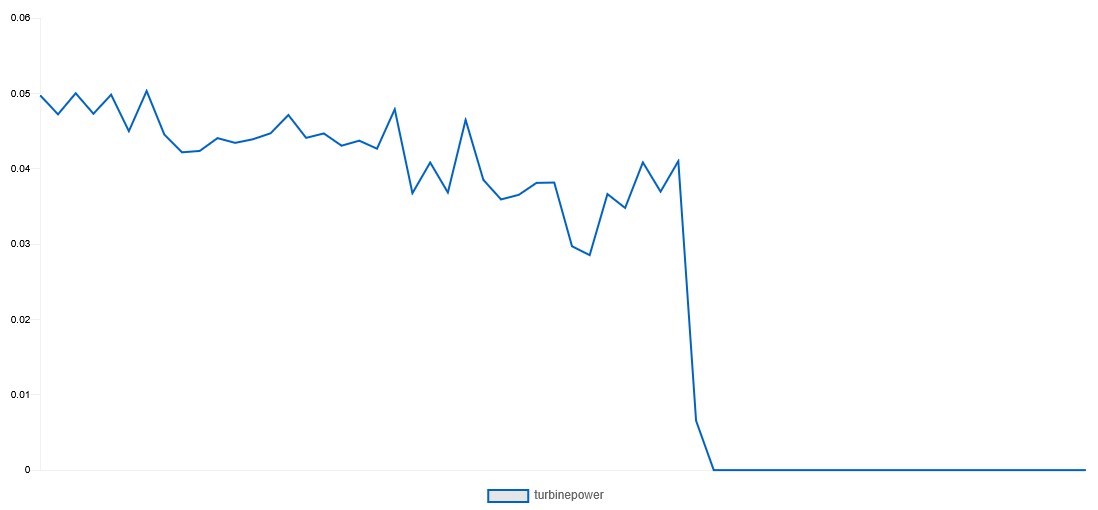
The next graph is the power generated by the turbine in mW.
I did all of the code for this project in python. The general idea was to use interrupt service routines (ISR) to read the GPIO pin changes and then do some math to figure out rotation speed and power generation. This was interesting because I've never done ISRs in python before. When I think of ISRs its generally related to C/C++ code.
While reading values I noticed a couple of things that were off. Occasionally the Pi would not report a value even with the ISR. As far as I can tell this was happening because the Pi was not an RTOS, so occasionally it would kick the python program out of the scheduling algorithm in favor of something else causing missed data. The best way I could mitigate this was averaging the data points over a couple of seconds to get more consistent readings (this also helped with the 30 data points a minute for Adafruit IO reporting).
Since I was working with hardware and sensors that weren't always the best, I did have to add in some fudge factors in the code to make sure the reported values from the ADC and hall sensor matched what I was reading using real measurement equipment (Oscilloscope and power analyzer). With all that in place I was getting consistent data that updated live to the Adafruit IO dashboard.
This project was a lot of fun and a great learning experience. Since I've gotten out of school I haven't had the chance to work on creating circuits much so this was a blast. It was really cool to go from the initial planning stages for what I wanted to do and then be able to make a bread boarded circuit become a PCB.
The Raspberry Pi python code was also interesting because I got to see how bad non-RTOS OS' are with sensors when they occasionally drop data. I didn't expect how badly it could throw off the data collection process. It was also interesting to use ISRs in python and see how they operated differently than the C/C++ systems I've used before. There was also the every present fudge factors needed to make sure the hardware sensors matched what was expected. This reminded me that the best software is always written with the hardware it is run on in mind.
| Qty | Value | Footprint | References |
|---|---|---|---|
| 3 | R | Resistor_THT:R_Axial_DIN0207_L6.3mm_D2.5mm_P7.62mm_Horizontal | R2, R3, R4 |
| 2 | Conn_01x02_Socket | Connector_PinHeader_2.54mm:PinHeader_1x02_P2.54mm_Vertical | J3, J4 |
| 1 | 1k | Resistor_THT:R_Axial_DIN0207_L6.3mm_D2.5mm_P7.62mm_Horizontal | R1 |
| 1 | Conn_01x04_Socket | Connector_PinHeader_2.54mm:PinHeader_1x04_P2.54mm_Vertical | J2 |
| 1 | MCP3008 | Package_DIP:DIP-16_W7.62mm | U1 |
| 1 | Raspberry_Pi_2_3 | Package_DIP:DIP-40_W15.24mm | J1 |
| 1 | TLV2372 | digikey-footprints:DIP-8_W12.7mm | U2 |
It measures 130 × 44.4 mm and has 2 copper layers, 1.6 mm thick.
10 parts, built around the MCP3008-I/P and TLV2372IP. The full list of its parts is on this page, with links to each part's symbol and footprint where PCBKit's library has them.
From the JohnRipple/turbine-sensor repository on GitHub, at the commit this page was made from: the board is Turbine KiCad Files/Turbine.kicad_pcb and its schematic Turbine KiCad Files/Turbine.kicad_sch. PCBKit opens the board in the browser, with nothing to install.
Its repository states no licence, so its author keeps all rights: ask JohnRipple before reusing the design.
Moragor/BatteryAnalyzer_MkII
Updated Version of the battery analyzer, now with constant current


devjamescollier/STM-32_Based_Waveform_Generator
USB-powered programmable function generator built around an STM32C031K6T6 microcontroller and MCP4901 DAC. Generates clean sine, triangle, and square waveforms with amplitude control via potentiometer, mode selection…

dnz1666/impedance-buffer-pcb
Analog circuit design (impedance buffer + LP filter) – KiCad schematic & PCB layout for a student EV project at RWTH Aachen


jensboe/Modellbahn
columns 1 block:selfmade block:base columns 1 nucleo adapter["adapter board A"] end space expansion1["expansion board A 1"] space expansionn["expansion board A n"] space expansionb["expansion board B"] adapter…

jkbkwcn/harm_meas_using_os
An electronic circuit project designed to measure mains current harmonics with amplitudes below one Least Significant Bit (LSB) of an Analog-to-Digital Converter.
