2 layers20.5 × 24.8 mm
 sharadkj/SageStack
Open-source telemetry platform for stage rally Hardware · Data Logger · Visualization
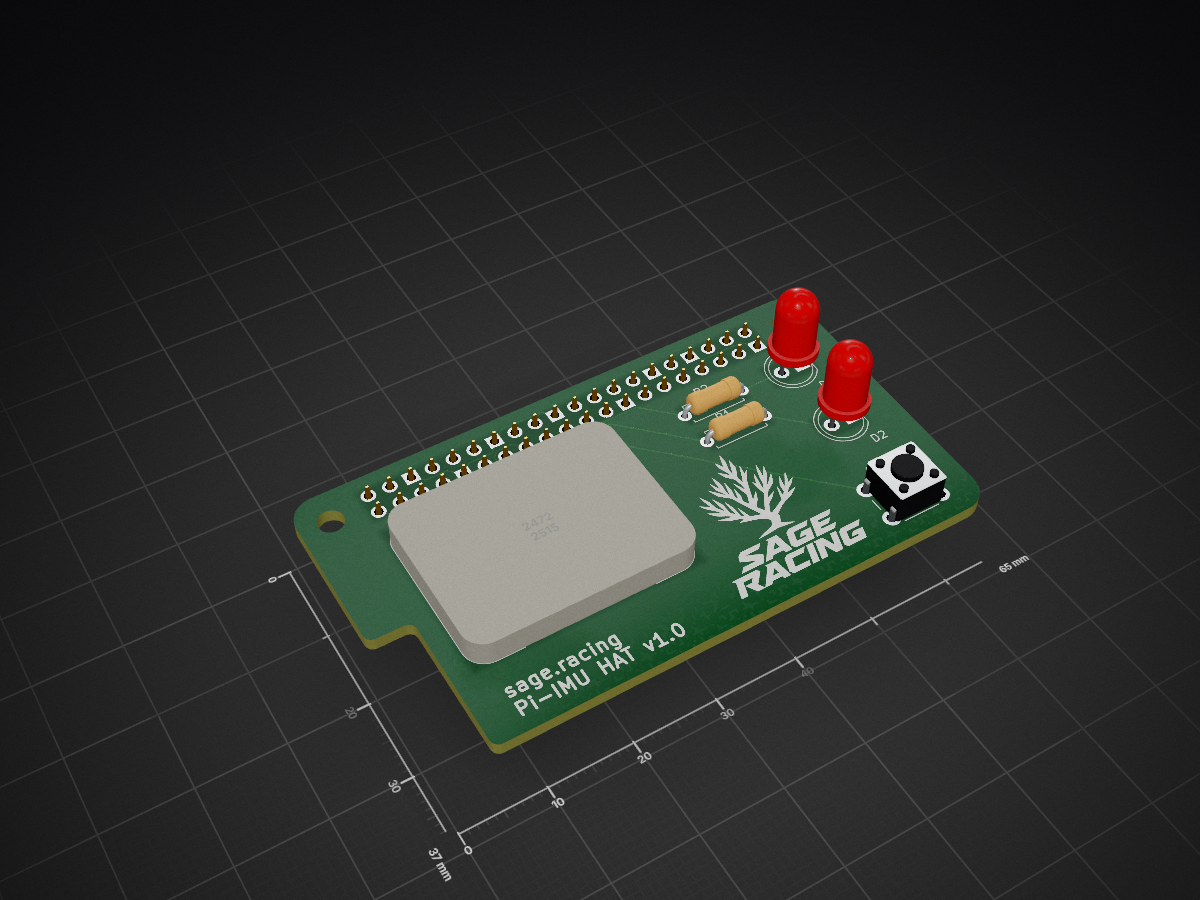
Imu pi5 header is an open-source printed circuit board by sharadkj, from the sharadkj/SageStack repository on GitHub, published under the MIT licence. It is a 2-layer board of 65 × 37 mm with 8 parts on 42 nets, routed with 36 tracks and 0 vias.
Its parts include 2 resistors, 2 diodes, 1 IC, 1 connector and 1 switch. It belongs with the sensors and measurement boards of this library.

Open-source telemetry platform for stage rally
Hardware · Data Logger · Visualization
Quick Start · Hardware · Data Logger · SageCompare · Contributing
SageStack is an end-to-end telemetry system purpose-built for stage rally. It combines a custom sensor board, a Raspberry Pi-based data logger, and a web application to capture, analyze, and compare driving data in real-time and after the fact.
Professional motorsport data acquisition systems cost thousands of dollars and are closed-source. They are also primarily designed for circuit racing where the lap-over-lap consistency is core to the insights they provide. SageStack provides an accessible, hackable alternative that:
SageStack/
├── imu_pi5_header/          # KiCAD PCB design files for the sensor hat
│   ├── imu_pi5_header.kicad_sch    # Schematic
│   ├── imu_pi5_header.kicad_pcb    # PCB layout
│   ├── imu_pi5_header.kicad_pro    # KiCAD project file
│   ├── imu_pi5_hat/                # Gerber manufacturing files (zipped)
│   ├── imu_pi5_led_hat/            # Alternate LED hat design
│   ├── libraries/                  # Custom footprints & 3D models
│   ├── DRC.rpt                     # Design Rule Check report
│   └── imu_pi5_hat.zip             # Ready-to-order Gerber package
│
├── rally-logger/            # Python data acquisition software
│   ├── rally_logger.py             # Core sensor polling & CSV writer
│   ├── watcher.py                  # GPIO button monitor (start/stop)
│   └── rally_log_*.csv             # Sample data from real test sessions
│
├── SageCompare/             # Web-based data visualization & comparison
│   ├── index.html                  # Entry point
│   ├── src/                        # Application source code
│   │   ├── main.js                 # Core application logic
│   │   └── style.css               # Styles
│   ├── package.json                # Dependencies (Vite, Leaflet, Chart.js)
│   └── vite.config.js              # Build configuration
│
├── logo_vectorized.svg      # Sage Racing brand logo
└── README.md # ← You are hereThe heart of SageStack is a custom PCB hat designed to sit directly on a Raspberry Pi 5's 40-pin GPIO header. All design files are in the imu_pi5_header/ directory and can be opened with KiCAD (v8+).
| Component | Description |
|---|---|
| BNO055 IMU | 9-axis Inertial Measurement Unit (accelerometer, gyroscope, magnetometer) with on-chip sensor fusion. Communicates over I²C. Provides roll, pitch, yaw, and linear acceleration. |
| GPS Module (external) | Not on the PCB itself — the GPS module connects to the Pi via USB (e.g., a USB GPS dongle appearing as /dev/ttyUSB0). This keeps the hat design simple and allows flexibility in GPS hardware choice. |
| Start/Stop Button | 6mm tactile momentary push button on GPIO 17 (BCM17, pin 11). Press to start a logging session, press again to stop. Active-low with internal pull-up. |
| Status LEDs | Two 5mm through-hole LEDs: Green on GPIO 27 (pin 13) — logging active. Red on GPIO 22 (pin 15) — standby/idle. Each driven through a current-limiting resistor. |
| 40-pin Pi Header | Standard Raspberry Pi 5 GPIO header for direct board-to-board mounting. |
| File | Purpose |
|---|---|
imu_pi5_header.kicad_sch | Full schematic — component connections, power rails, I²C bus, UART GPS, GPIO button/LED |
imu_pi5_header.kicad_pcb | PCB layout — 2-layer board with component placement and routing |
imu_pi5_header.kicad_pro | KiCAD project configuration |
imu_pi5_hat.zip | Ready-to-order Gerber files — upload directly to PCB fab houses (JLCPCB, PCBWay, OSH Park, etc.) |
DRC.rpt | Design Rule Check report showing board passes validation |
libraries/ | Custom component footprints and 3D models used in the design |
imu_pi5_hat/ | Extracted Gerber/drill files for manufacturing |
imu_pi5_led_hat/ | Alternate version of the hat design with a different LED layout |
imu_pi5_hat.zip from the imu_pi5_header/ directory| Part | Quantity | Notes |
|---|---|---|
| Raspberry Pi 5 | 1 | Any RAM variant works |
| BNO055 breakout board | 1 | Adafruit BNO055 or equivalent I²C module |
| GPS module | 1 | UART-based (e.g., Adafruit Ultimate GPS, u-blox NEO series) |
| Custom PCB (this project) | 1 | Order from Gerber files above |
| USB GPS dongle | 1 | Any USB GPS (e.g., VK-162, u-blox 7/8 based). Appears as /dev/ttyUSB0. |
| Momentary push button | 1 | 6mm tactile through-hole. Panel mount recommended for in-car use. |
| LEDs | 2 | 5mm through-hole — 1× green, 1× red — with appropriate resistors |
| 2×20 pin header | 1 | For Pi GPIO connection (or use stacking header for access to pins) |
| Resistors | 2 | LED current limiting (220Ω–1kΩ typical), axial through-hole |
Tip: A 2×20 stacking header is recommended instead of a standard pin header. This allows you to mount additional boards or access GPIO pins above the hat.
PCB Notes: The board is a standard 2-layer Raspberry Pi HAT form factor (~65mm × 37mm) with 4 mounting holes. All components are through-hole for easy hand-soldering — no SMD skills required. The back copper layer includes a ground fill zone.
The data acquisition software lives in rally-logger/ and consists of two Python scripts that run on the Raspberry Pi.
┌─────────────┐     GPIO      ┌──────────────┐
│  Button on  │───────────────▶│  watcher.py  │
│  sensor hat │                │  (monitors   │
└─────────────┘                │   button)    │
                               └──────┬───────┘
                                      │ subprocess
                                      ▼
                               ┌──────────────┐
                               │rally_logger.py│
            ┌──────────────────│  (main loop)  │──────────────────┐
            │                  └──────────────┘                   │
            ▼                                                     ▼
    ┌───────────────┐                                  ┌──────────────────┐
    │  BNO055 IMU   │                                  │   GPS Module     │
    │  (I²C bus)    │                                  │   (UART serial)  │
    │               │                                  │                  │
    │ • Roll/Pitch  │                                  │ • Lat/Lon        │
    │ • Yaw         │                                  │ • Altitude       │
    │ • Accel X/Y/Z │                                  │ • Speed (km/h)   │
    │ • Calib stat  │                                  │ • Fix status     │
    └───────────────┘                                  └──────────────────┘
            │                                                     │
            └──────────────────┬──────────────────────────────────┘
▼watcher.py — Button MonitorThis script runs continuously on boot and watches for button presses on the GPIO pin connected to the start/stop button on the sensor hat.
How it works:
gpiozero library for clean GPIO access (Button and LED classes)rally_logger.py as a child process via subprocess.Popen()
terminate() signal to stop the logger
/mnt/usb_drive (if a USB drive is mounted)signal.pause() — fully event-drivenGPIO pin map:
| GPIO (BCM) | Pi Header Pin | Function |
|---|---|---|
| GPIO 17 | Pin 11 | Push button input (to GND) |
| GPIO 27 | Pin 13 | Green LED — logging active |
| GPIO 22 | Pin 15 | Red LED — standby / idle |
rally_logger.py — Data AcquisitionThis is the core data collection script. It initializes both sensors and polls them in a tight loop, writing each sample to a CSV file.
How it works:
adafruit_bno055 library/dev/ttyUSB0 at 9600 baud) using adafruit_gpsrally_log_1772928049.csv)time.sleep(0.1) target, achieving approximately 7.7 Hz (~130ms per sample including I²C overhead):
f.flush() on every iteration to protect against data loss on power cutwatcher.py (SIGTERM) or a keyboard interruptEach log file contains the following columns:
| Column | Unit | Description |
|---|---|---|
timestamp | Unix epoch (seconds) | High-resolution timestamp with microsecond precision |
lat | Decimal degrees | GPS latitude (WGS84). Empty until first GPS fix. |
lon | Decimal degrees | GPS longitude (WGS84). Empty until first GPS fix. |
alt | Meters | GPS altitude above mean sea level |
speed_kmh | km/h | GPS-derived ground speed |
roll | Degrees | Vehicle roll angle (left/right lean) |
pitch | Degrees | Vehicle pitch angle (nose up/down) |
yaw | Degrees | Vehicle heading (0–360°, magnetic north) |
accel_x | m/s² | Lateral acceleration (positive = right) |
accel_y | m/s² | Longitudinal acceleration (positive = forward) |
accel_z | m/s² | Vertical acceleration (~9.8 m/s² at rest) |
calib_stat | 0–3 | BNO055 system calibration quality (3 = fully calibrated) |
Example data:
timestamp,lat,lon,alt,speed_kmh,roll,pitch,yaw,accel_x,accel_y,accel_z,calib_stat
1772928049.541173,,,,0.0,0.0,0.0,0.0,-0.15,-1.48,9.38,0
1772928050.061291,29.998476,-97.55066,139.7,0.018,-0.6875,8.8125,359.9375,-0.16,-1.45,9.38,0
Note: GPS fields may be empty for the first few rows while the module acquires a satellite fix. The IMU data is available immediately.
adafruit-circuitpython-bno055    # BNO055 IMU driver (I²C)
adafruit-circuitpython-gps       # GPS NMEA parser
adafruit-blinka                  # CircuitPython compatibility layer for Raspberry Pi
                                 # (provides board, busio modules)
pyserial                         # Serial communication for USB GPS
gpiozero                         # GPIO access for button & LEDs (used by watcher.py)
Note:
boardandbusioare provided byadafruit-blinka.gpiozerocomes pre-installed on Raspberry Pi OS but may need to be installed on minimal images.
raspi-config:
sudo raspi-config
# Interface Options → I2C → Enable
# Interface Options → Serial Port → Disable login shell, Enable serial hardwaresudo apt update && sudo apt install -y python3-pip
pip3 install adafruit-circuitpython-bno055 adafruit-circuitpython-gps adafruit-blinka pyserial gpiozerosudo i2cdetect -y 1 (should show the BNO055 at address 0x28 or 0x29)ls /dev/ttyUSB0 (should exist when GPS is plugged in)python3 rally_logger.py
# Press Ctrl+C to stop — check for a new rally_log_*.csv file# Add to /etc/rc.local or create a systemd service:
sudo nano /etc/systemd/system/sage-watcher.service[Unit]
Description=SageStack Rally Logger Watcher
After=multi-user.target
[Service]
Type=simple
ExecStart=/usr/bin/python3 /home/pi/SageStack/rally-logger/watcher.py
WorkingDirectory=/home/pi/SageStack/rally-logger
Restart=always
User=root
[Install]
WantedBy=multi-user.targetsudo systemctl enable sage-watcher
sudo systemctl start sage-watcher/mnt/usb_drive, the CSV is automatically copied to itSageCompare is a browser-based data visualization and run comparison tool built with modern JavaScript. It lives in the SageCompare/ directory.
SageCompare is a run comparison tool — upload two CSV files from different runs and analyze performance differences side-by-side. The app features 5 specialized analysis views accessible via tabs:
| Technology | Purpose |
|---|---|
| Vite | Fast dev server and build tool |
| Leaflet | Interactive GPS track maps with CartoDB dark basemap tiles |
| Chart.js + chartjs-plugin-zoom | Time-series and scatter plot visualization with zoom/pan |
| Vanilla JavaScript (ES Modules) | No framework overhead — pure DOM manipulation |
| CSS3 | Dark theme with glassmorphism, custom properties, responsive grid |
| Google Fonts | Inter (UI) + JetBrains Mono (data display) |
# Navigate to the SageCompare directory
cd SageCompare

# Install dependencies
npm install

# Start the dev server
npm run dev
The app will open at http://localhost:5173 (or the next available port).
SageCompare/
├── index.html                    # Shell: header, tab nav, upload zones, view containers
├── src/
│   ├── main.js                   # Entry point: upload handling, CSV parsing,
│   │                             #   cool-down trimming, alignment, filter control
│   ├── views/
│   │   ├── compare-dashboard.js  # Dashboard: maps + 8 overlaid charts
│   │   ├── compare-braking.js    # Threshold braking analysis
│   │   ├── compare-slalom.js     # Slalom rhythm analysis
│   │   ├── compare-dynamic.js    # Dynamic slalom / friction circles
│   │   └── compare-stage.js      # Stage driving / sector analysis
│   └── styles/
│       └── index.css             # Complete design system (~1000 lines)
├── package.json                  # Dependencies
└── vite.config.js                # @core alias to shared core library
The app uses a shared core library (aliased as @core in Vite config) that provides reusable modules for CSV parsing, signal filtering, chart creation, and rally-specific analysis algorithms:
parser.js — CSV parsing and raw data processingfilter.js — Butterworth low-pass filter with configurable cutoffcharts.js — Chart.js wrapper utilities and color paletteanalysis.js — Braking zone detection, slalom rhythm analysis, friction circle calculation, sector splittingrally_log_*.csv files — one into the Run A (cyan) zone and one into Run B (pink)cd SageCompare
npm run build
# Output in dist/ — deploy to any static hosting (Netlify, Vercel, GitHub Pages, etc.)| Category | Items |
|---|---|
| Hardware | Raspberry Pi 5, BNO055 IMU breakout (Adafruit 2472), USB GPS dongle, custom PCB (or breadboard prototype), 6mm button, 2× LEDs + resistors, USB-C power source |
| Software (Pi) | Raspberry Pi OS (64-bit), Python 3.9+, I²C enabled |
| Software (Desktop) | Node.js 18+, npm, a modern web browser (Chrome/Firefox/Edge) |
| Optional | KiCAD 8+ (only if modifying the PCB design) |
Build the hardware
Set up the Raspberry Pi
# Enable interfaces
sudo raspi-config  # Enable I2C and Serial

# Install dependencies
pip3 install adafruit-circuitpython-bno055 adafruit-circuitpython-gps adafruit-blinka pyserial gpiozero

# Clone the repo
git clone https://github.com/YOUR_ORG/SageStack.git
cd SageStack/rally-logger

# Test the logger
python3 rally_logger.py
Collect data
watcher.py (or set it up as a systemd service)Analyze your data
cd SageStack/SageCompare
npm install
npm run devSageStack is an active work in progress. Here's what's current:
| Component | Status | Notes |
|---|---|---|
| Sensor Hat PCB | ✅ Tested | v1 validated in real vehicle testing. Gerbers ready to order. |
| Rally Logger | ✅ Tested | Actively collecting data. Sample logs from real sessions included. |
| SageCompare | 🔨 In Development | Core visualization working. Comparison features being expanded. |
| Documentation | 📝 In Progress | This README. More detailed guides coming. |
calib_stat column shows calibration quality (0 = uncalibrated, 3 = fully calibrated).SageStack is built for the rally community, and contributions are welcome! Whether you're a hardware hacker, Python developer, web developer, or rally driver with feedback — there's a place for you.
We're actively looking for:
If you'd like to partner with us, please reach out (sharad.k.jones@gmail.com)!
License information to be determined. Please check back or contact the maintainers.
Built with ❤️ for the dirt — by Sage Racing
| Qty | Value | Footprint | References |
|---|---|---|---|
| 2 | LED | LED_THT:LED_D5.0mm | D1, D2 |
| 2 | R | Resistor_THT:R_Axial_DIN0207_L6.3mm_D2.5mm_P7.62mm_Horizontal | R1, R2 |
| 1 | 2472 | 2472:MODULE_2472 | U1 |
| 1 | LOGO | LOGO | G*** |
| 1 | RPi_GPIO | RPI_Hat:RPI_Hat_B+ | J1 |
| 1 | SW_Push | Button_Switch_THT:SW_PUSH_6mm | SW1 |

joeycastillo/Sensor-Watch
A board replacement for the classic Casio F-91W wristwatch

rusefi/rusefi
rusefi - GPL internal combustion engine control unit

hoglet67/RGBtoHDMI
Bare-metal Raspberry Pi project that provides pixel-perfect sampling of Retro Computer RGB/YUV video and conversion to HDMI

shanteacontrols/OpenDeck
A platform for building interactive control and sensing devices using MIDI and OSC built with Zephyr RTOS.

hackclub/OnBoard
💡 Join 1,000 teenagers and make your first PCB with a $100 grant!

dangiu/PicoMemcard
Emulating PSX Memory Card (or controller) using a Raspberry Pi Pico

OLIMEX/DIY-LAPTOP
Do It Yourself Open Source Hardware and Software Modular Hacker's Friendly Laptop
It measures 65 × 37 mm and has 2 copper layers, 1.6 mm thick.
8 parts. The full list of its parts is on this page, with links to each part's symbol and footprint where PCBKit's library has them.
From the sharadkj/SageStack repository on GitHub, at the commit this page was made from: the board is imu_pi5_header/imu_pi5_header.kicad_pcb and its schematic imu_pi5_header/imu_pi5_header.kicad_sch. PCBKit opens the board in the browser, with nothing to install.
Its repository publishes it under the MIT licence: you may reuse it on that licence's terms (keep the author's notice, and for a copyleft licence share your changes alike).