
2 layers72 × 50 mm
SensorHub
Kampi/SensorHub
Solar-powered, low energy environment sensor node with WiFi interface.
42 parts1GPL-3.0

 Raziz1/Solar_PCB2
A power management PCB designed to charge a lithium-ion battery and power a low-power Arduino application
Solar PCB KiCad is an open-source printed circuit board by Raziz1, from the Raziz1/Solar_PCB repository on GitHub. It is a 2-layer board of 70 × 39 mm with 25 parts on 15 nets, routed with 45 tracks and 158 vias.
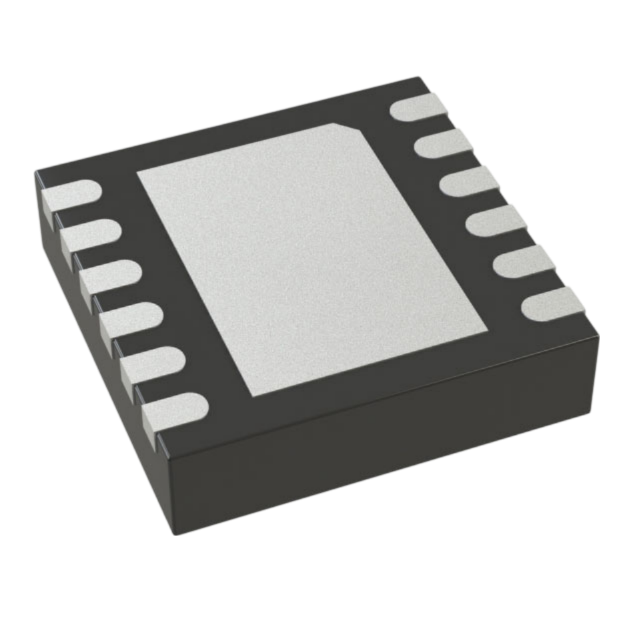
It is built around the LT3652EMSE#PBF. Its parts include 8 resistors, 6 capacitors, 5 diodes, 3 connectors and 1 IC. It belongs with the power boards of this library.
The following project is a power management PCB designed to charge a lithium-ion battery using a solar panel and discharge it into an Arduino for low-power applications.
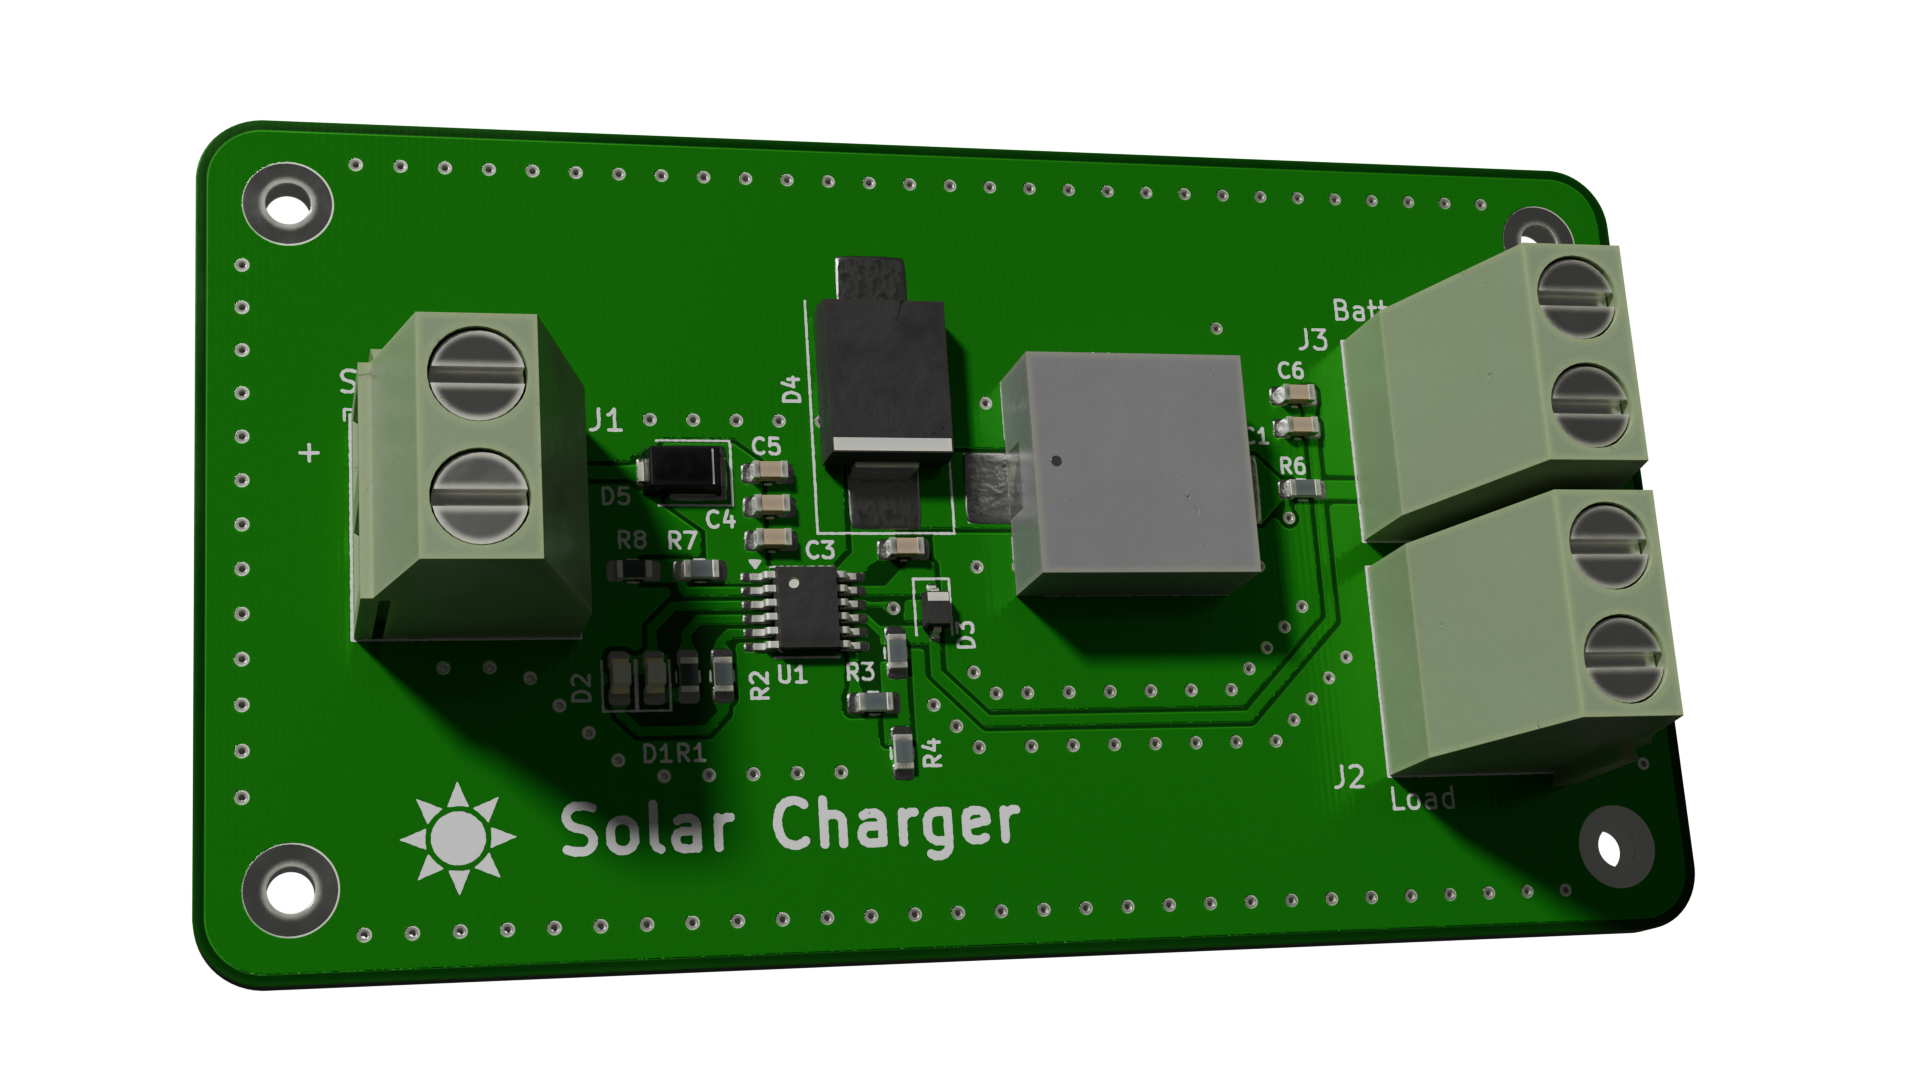
Blender Render
Before diving into the PCB design I am going to explore the low-power application that I have designed for this project. The application Full_Functionality.ino utilizes the DHT11 sensor to record temperature and humidity readings, then writes them to the onboard EEPROM (1 KB). Once the data has been stored in the EEPROM the arduino goes into a lower power state by utilizing the narcoleptic library. I am running this entire application on an Arduino Uno REV3.
For this application, I would like the Arduino to last as long as possible on battery power. To reduce it's power consumption I referenced the following two articles: The Arduino Guide to Low Power Design, Arduino minimal power usage, and Power saving techniques for microprocessors . A lot of the common techniques involved disabling unused peripherals, reducing clock speeds, and forcing the CPU into a low power mode. One extremely effective method that I did not attempt was utilizing a "bare bones" Atmega328 board. By stripping away a lot of unnecessary components (i.e. USB controller, LDO, etc...) you can significantly reduce the power consumption.
| Arduino | DHT11 |
|---|---|
| 5V | VCC |
| GND | GND |
| 2/PD2 | DATA |
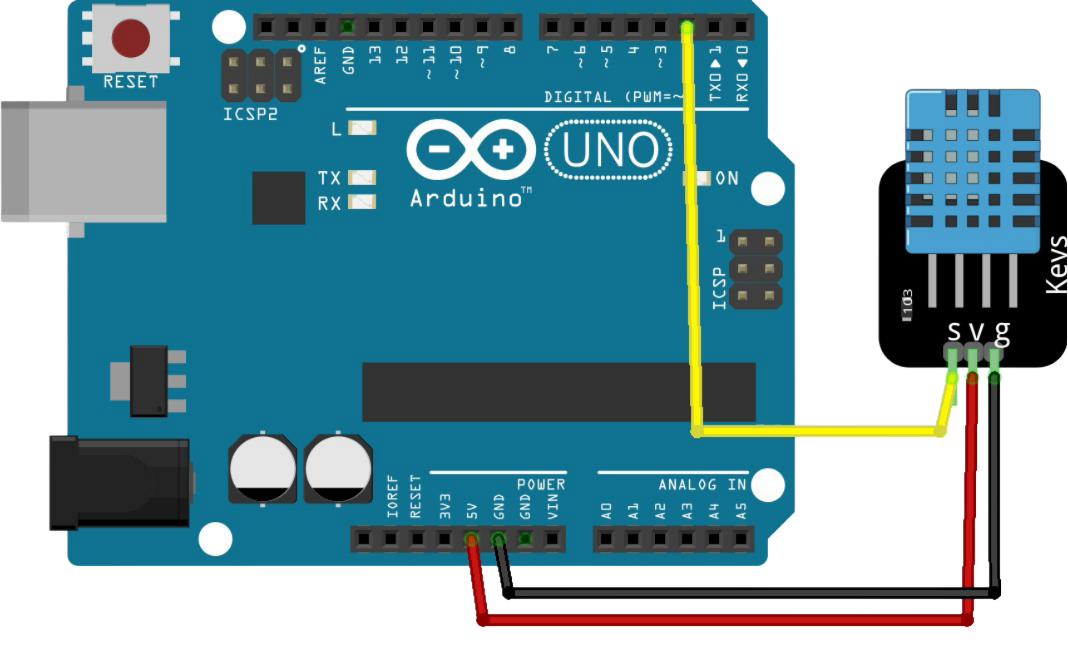
Arduino Pin-out
To test the power consumption of the Arduino, I used a bench power supply, a 100-ohm shunt resistor, and the Analog Discovery 2 USB oscilloscope.
For the first test I had the Arduino running the default sketch as seen below.
void setup () {}
void loop () {}
The current consumption was measured at two supply voltage levels: 12V and 8V. Realistically, for our application, we will be running the Arduino off 8V through the barrel connector.
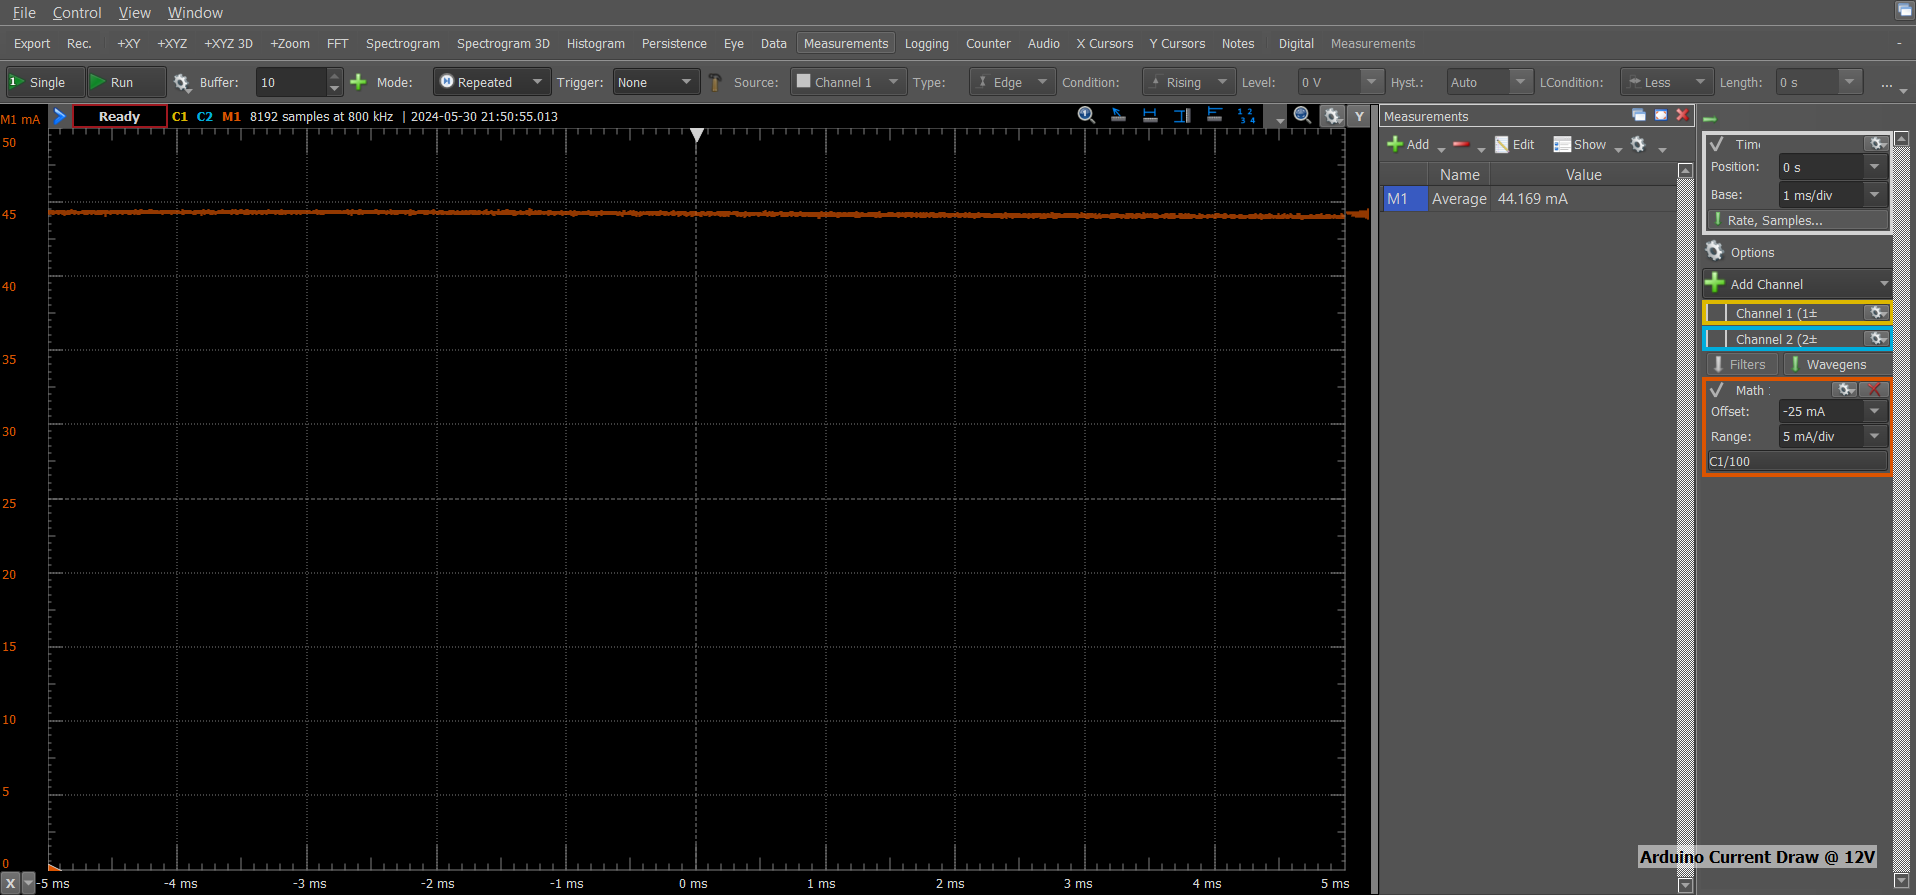
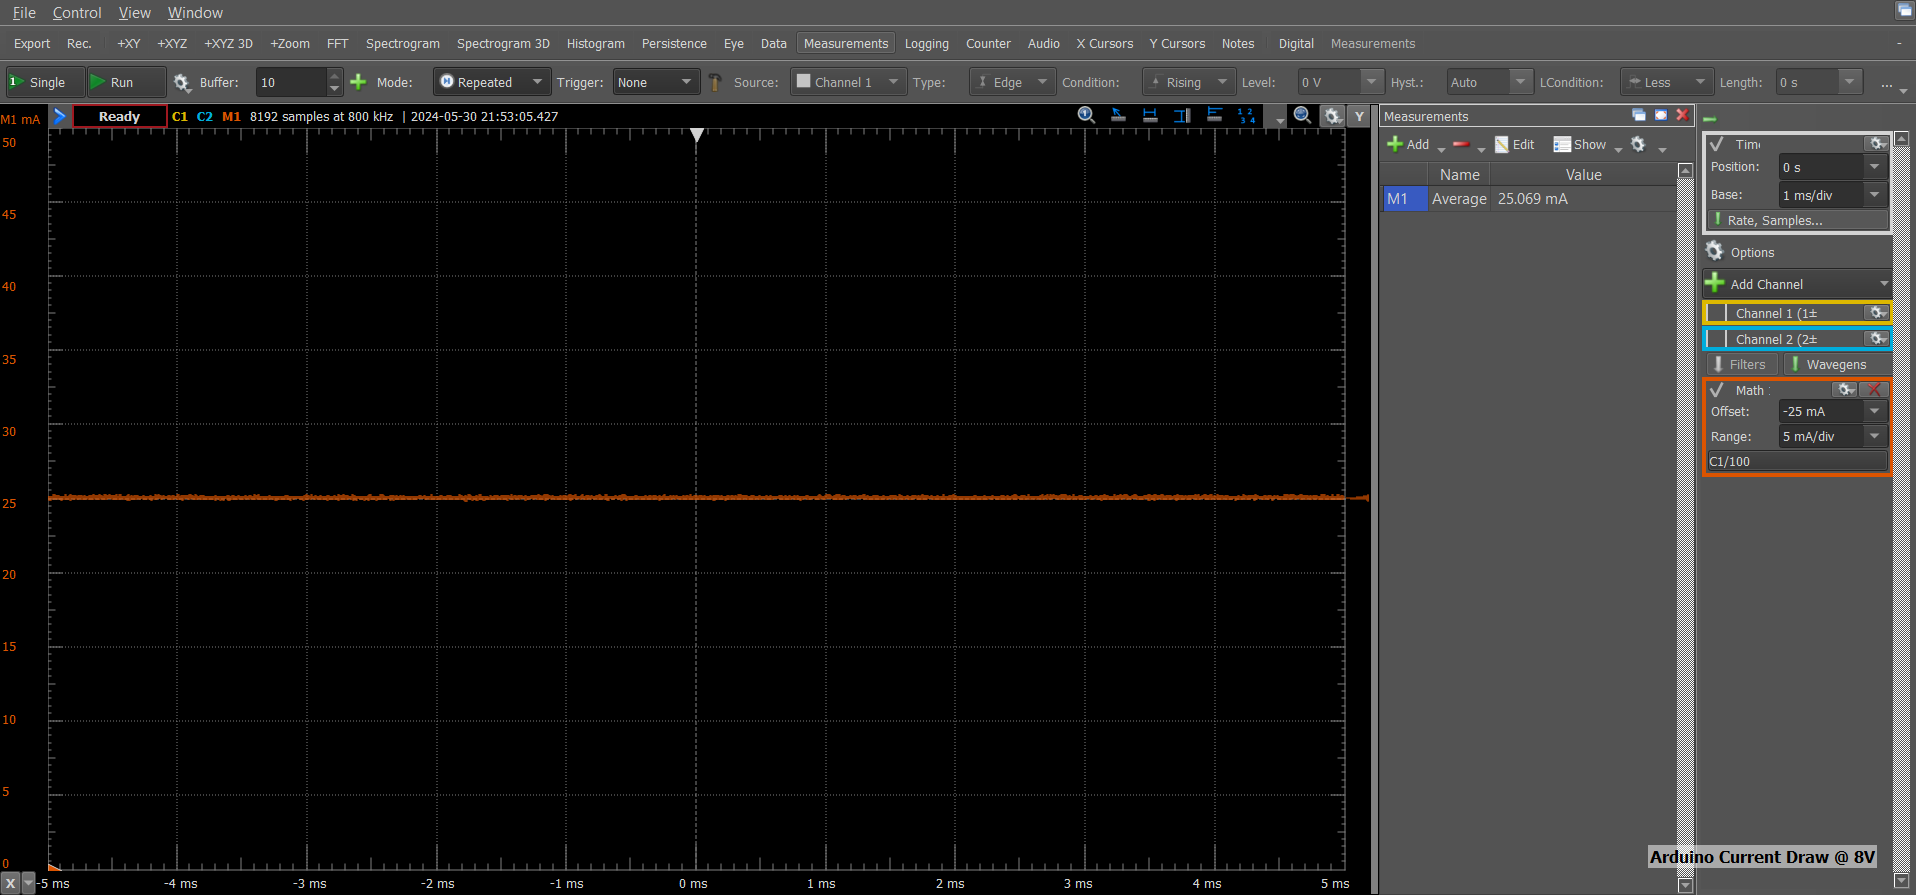
Current Draw 12V [LEFT] vs 8V [RIGHT]
The Low_Power_Sketch.ino utilizes the sleep, wdt, and power library to lower the Arduino's power consumption. To lower the Arduino's power consumption I did the following:
The resulting current consumptions was:
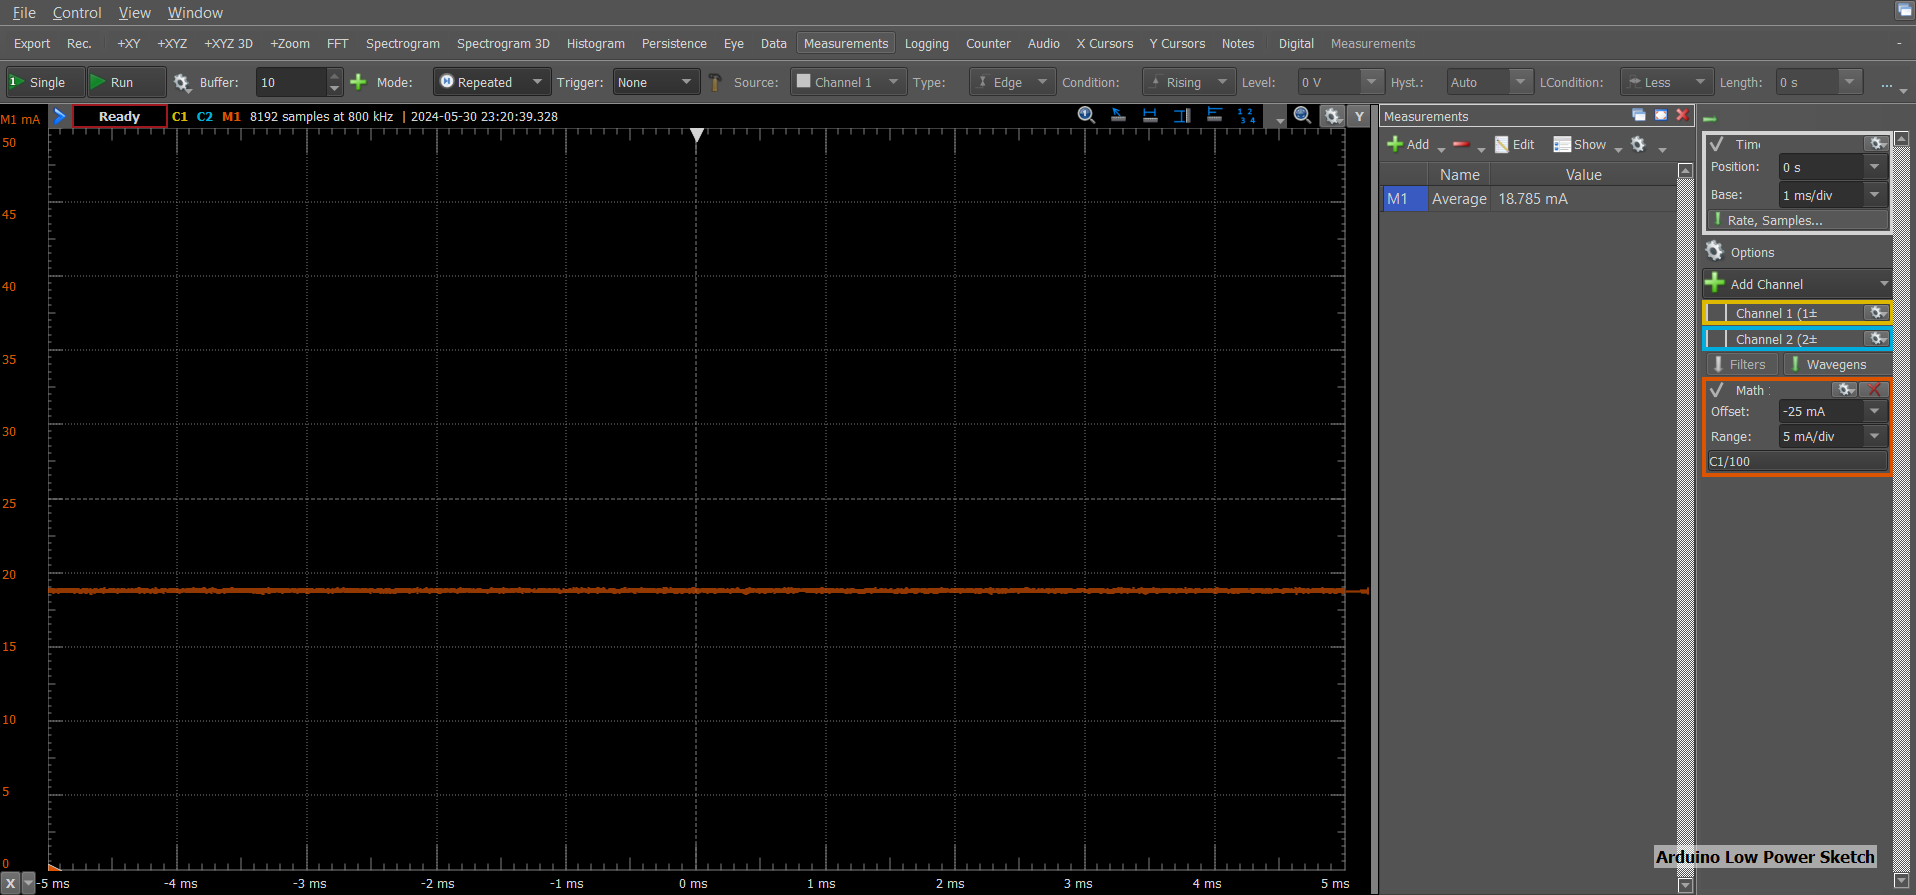
Current Draw Low_Power_Sketch.ino
The Narcoleptic_Sketch.ino uses many of the same techniques as the above sketch; however, this script utilizes the Narcoleptic library to achieve its low power consumption. The following techniques were used:
The resulting current consumptions was:
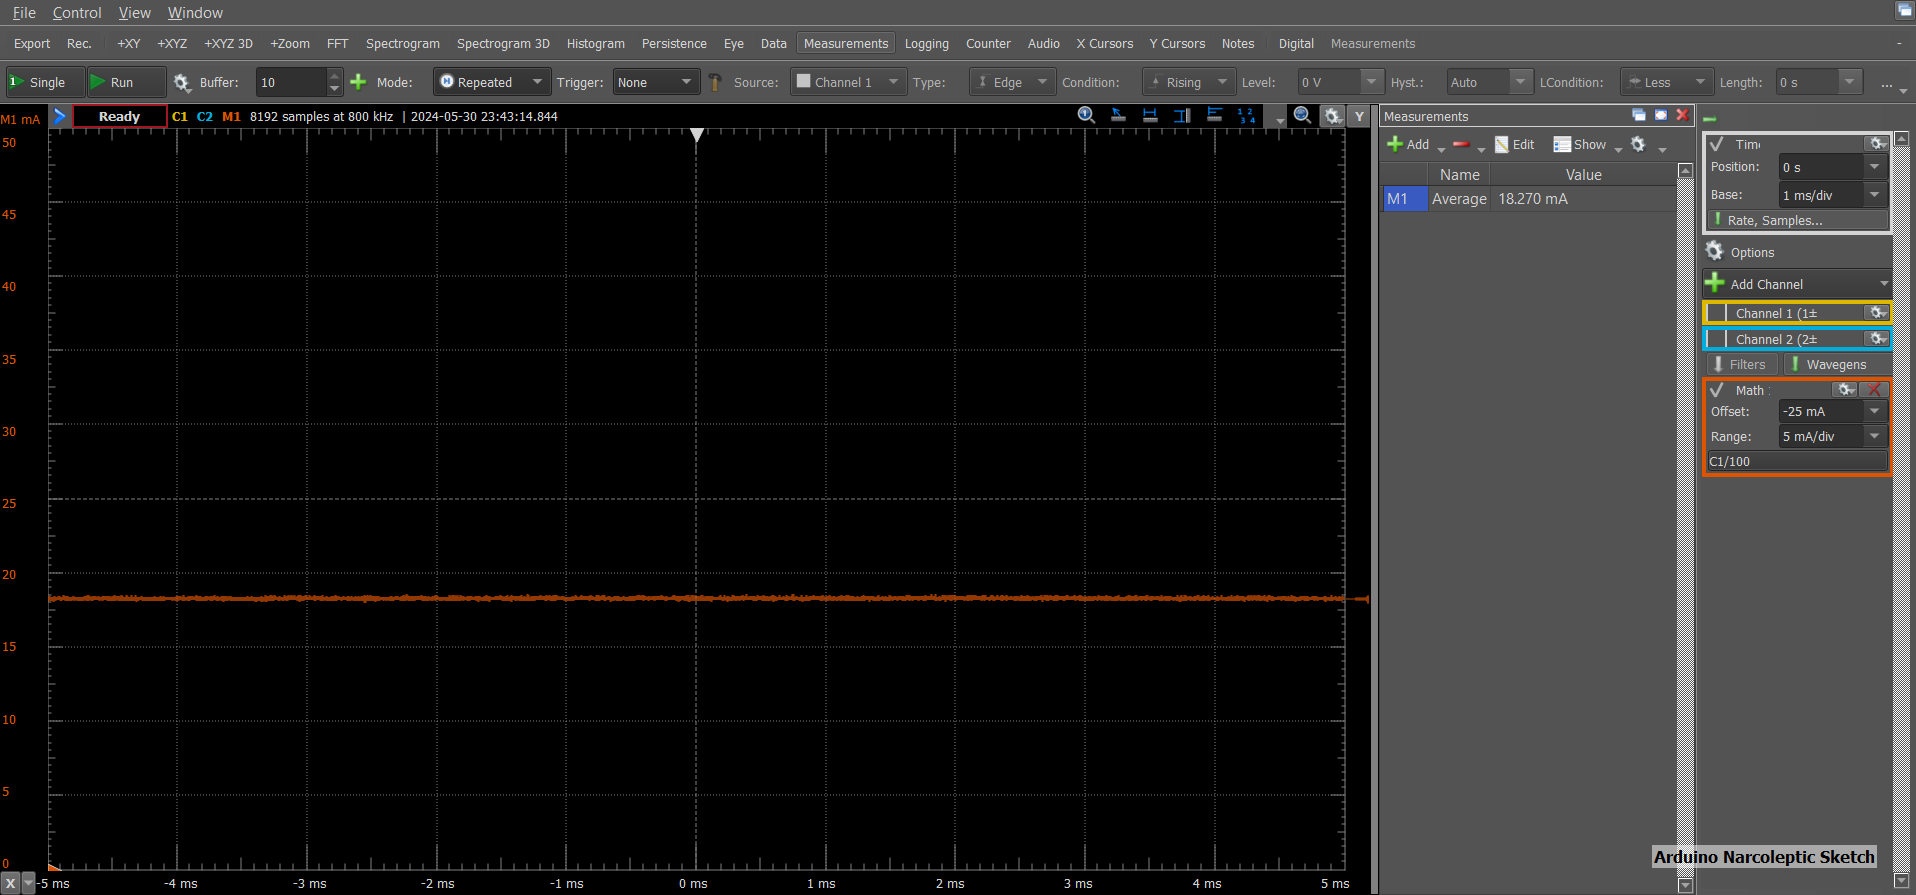
Current Draw Narcoleptic_Sketch.ino
The Full_Functionality.ino sketch is the main program that performs the tasks described in the introduction while using the low power modes that were used in Narcoleptic_Sketch.ino.
The resulting current consumptions was:
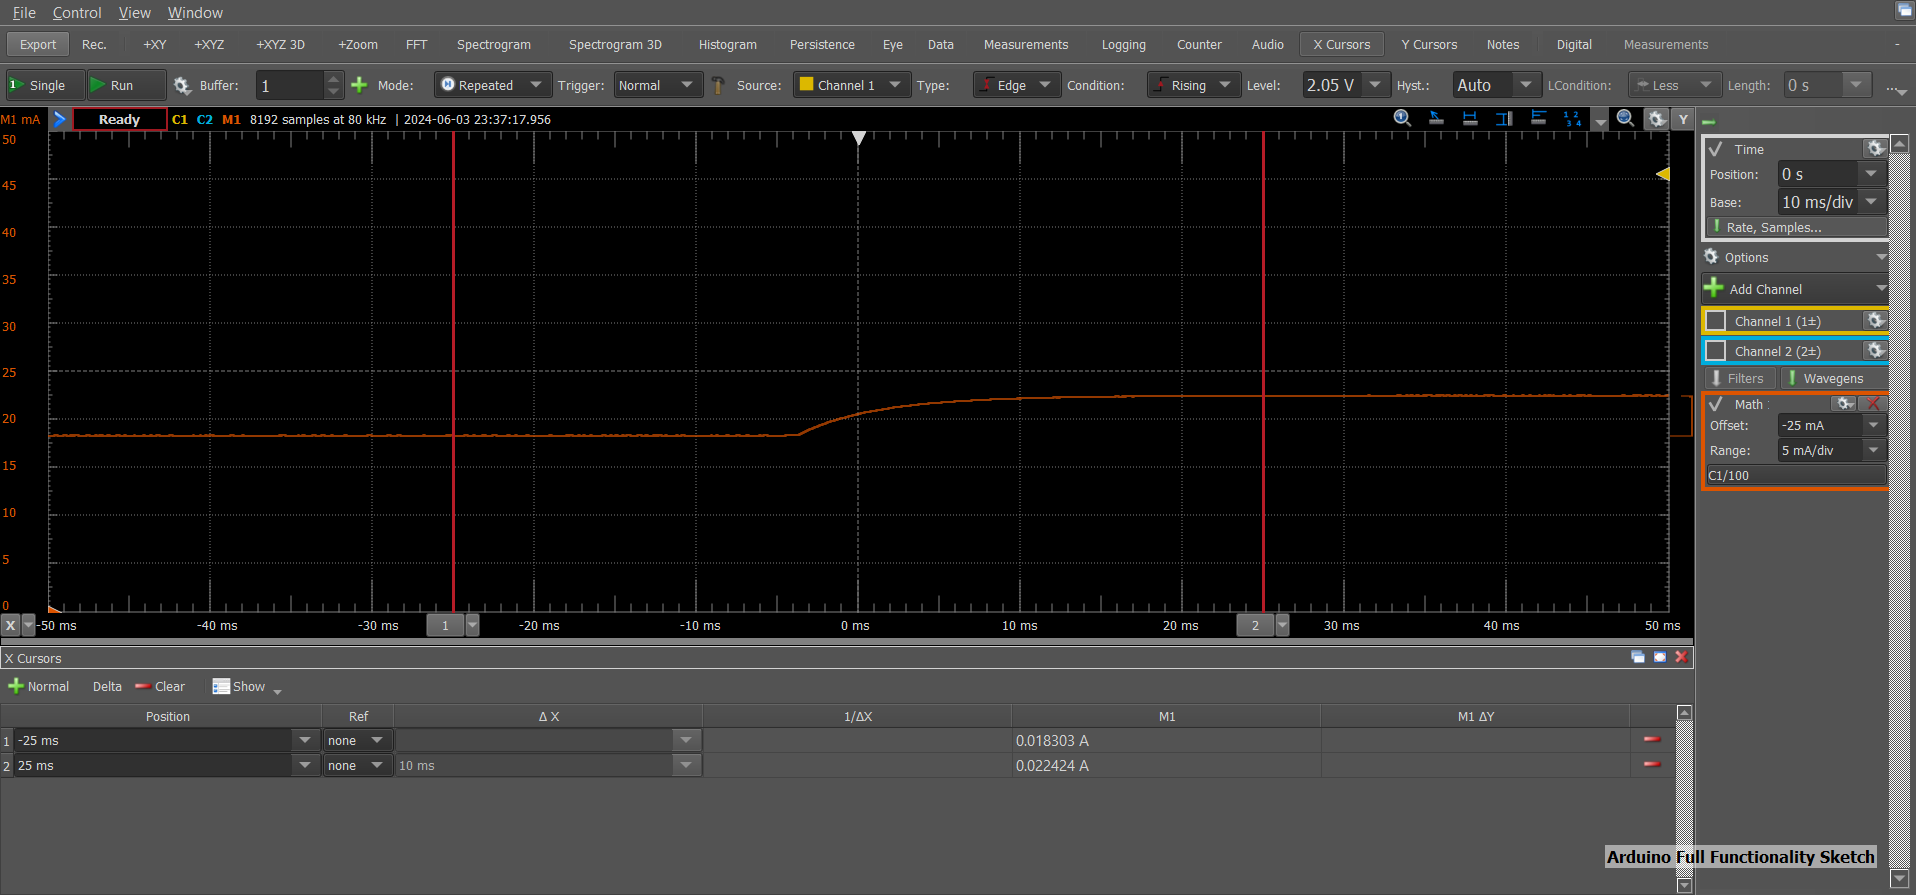
Full_Functionality.ino Low power mode [LEFT] vs Awake mode [RIGHT]
Despite the power savings documented above, there are still quite a few methods that were left out during this process, which can yield large power savings.
Now that we know the power consumption of the Arduino, we can begin picking components for this project. This section will focus on the choice of solar panel and lithium-ion battery.
For the battery, I ended up selecting a pair of lithium-ion batteries I already had at home. The batteries were two 3.7V 2600mAh lithium-ion batteries from PKCELL. The batteries were arranged in series in a battery pack to produce an output voltage of 7.4V and a capacity of 2600 mAh. Li-ion Battery ICR18650 2600mAh 3.7V Datasheet. Some important specifications to note about this battery are the following:
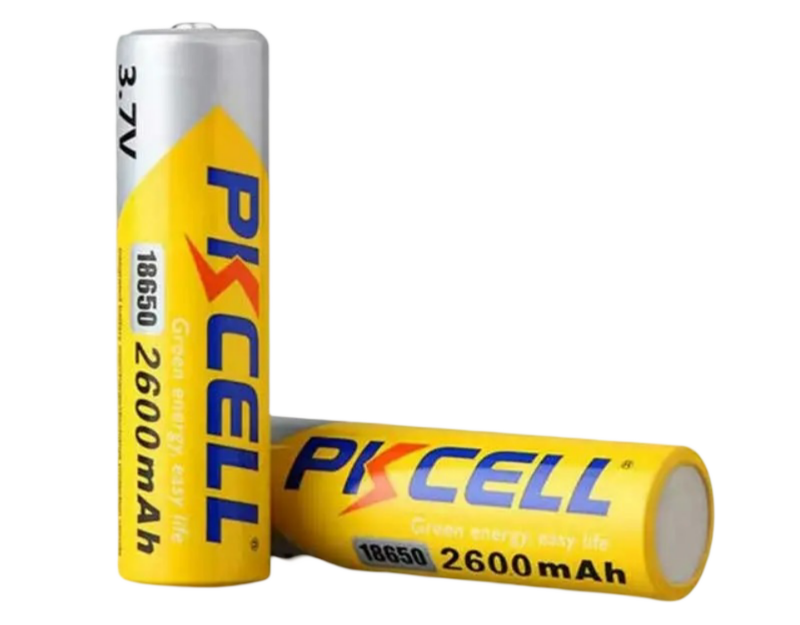
PKCELL Lithium Ion Batteries
Now that we know the battery capacity and the Arduino's current consumption, we can determine the lifespan of the battery while supplying the Arduino.
| Variable | Description | Value |
|---|---|---|
| C | Battery Capacity | 2600 mAh |
| Is | Current while sleeping | 18.3mA |
| Ia | Current while awake | 22.4mA |
| Wph | # of wakeups per hour | 1 |
| Wt | Duration of a single wake | 1s |
Time awake per hour: ${Twph=Wph\cdot Wt=1s}$
Time asleep per hour: ${Tsph=msph-Wtph=3599s}$
Average current draw: ${Iavg=\left(\left(Ia\cdot Twph\right)+\left(Is\cdot Tsph\right)\right)/3600s=18.3011\thinspace mA}$
Life of battery: ${\frac{C}{I_{avg}}=\frac{2600mAh}{18.3011mA}=142.067\thinspace hours=5.919\thinspace days}$
Alternatively, you could use this Battery Life Calculator, which includes the self-discharge rate of a battery in its calculations. Based on this calculator, the battery's life ends up being 5.03 days.
To increase the lifespan of the battery, you could further decrease the current consumption of the Arduino using the previously mentioned methods, or you could hook up a solar panel to recharge the batteries.
After a bit of searching I was able to find a 12V 4.2W (350mA Max) portable solar panel module.
If we assume ideal conditions where the sun is visible 100% of the day we can determine how long it would take for the solar panel to recharge the battery.
${t=\frac{Q}{I}=\frac{2600}{350}=7.42\thinspace hours}$
For real-world conditions, we can assume that the total hourly power is closer to 50% of the solar panel's maximum power (175mA). Additionally, we can include the power consumption of the Arduino, which is around 18.3mA.
${I_{net}=I_{solar}-I_{net}=175\thinspace mA-18.3\thinspace mA=156.7\thinspace mA}$
${t=\frac{Q}{I_{net}}=\frac{2600}{156.7}=16.6\thinspace hours}$
The battery management IC being used in this project is the LT3652
${I_{CVIN\left(RMS\right)}≅I_{CHG\left(MAX\right)}•\left(V_{BAT}/V_{IN}\right)•\left(\left[V_{IN}/V_{BAT}\right]-1\right)^{\frac{1}{2}}}$
${I_{CVIN\left(RMS\right)}=0.5\cdot \left(\frac{7.4}{12}\right)\cdot \left(\left(\frac{12}{7.4}\right)-1\right)^{\frac{1}{2}}=0.19447\thinspace A}$
Bulk capacitance is a function of desired input ripple voltage (ΔVIN), and follows the relation: ${C_{IN{\left(BULK\right)}}=I_{CHG{\left(MAX\right)}}•\left(V_{BAT}/V_{IN}\right)/∆V_{IN}\thinspace \left(µF\right)}$
${C_{IN\left(BULK\right)}=0.4\cdot \frac{\left(\frac{7.4}{12}\right)}{0.1}=2.46\thinspace uF}$
The data sheet describes the charge current programming as follows: "The LT3652 charger is configurable to charge at average currents as high as 2A. Maximum charge current is set by choosing an inductor sense resistor (RSENSE)..."
${R_{SENSE}\thinspace = \thinspace 0.1/I_{CHG\left(MAX\right)}}$
The maximum charging current is limited by the maximum current output of the solar panel, which is 350 mA. Therefore, we can set the limit to 400 mA to allow for some headroom.
${R_{SENSE}\thinspace = \thinspace 0.1/I_{CHG\left(MAX\right)}=0.1/0.4=0.25Ω}$
The voltage on the decoupling capacitor is refreshed through a diode, with the anode connected to either the battery output voltage or an external source, and the cathode connected to the BOOST pin. Rate the diode average current greater than 0.1A, and reverse voltage greater than VIN(MAX).
When an LT3652 charger is not switching, the SW pin is at the same potential as the battery, which can be as high as VBAT(FLT). As such, for reliable start-up, the VIN supply must be at least 3.3V above VBAT(FLT). Once switching begins and the BOOST supply capacitor gets charged such that (VBOOST – VSW) > 2V, the VIN requirement no longer applies.
An LT3652 charger output requires bypass capacitance connected from the BAT pin to ground (CBAT). A 10µF ceramic capacitor is required for all applications.
The primary criterion for inductor value selection in an LT3652 charger is the ripple current created in that inductor.
The rectifier diode from SW to GND, in a LT3652 battery charger provides a current path for the inductor current when the main power switch is disabled. The rectifier is selected based upon forward voltage, reverse voltage, and maximum current. A Schottky diode is required, as low forward voltage yields the lowest power loss and highest efficiency. The rectifier diode must be rated to withstand reverse voltages greater than the maximum VIN voltage.
The minimum average diode current rating (${I_{DIODE\left(MAX\right)}}$) is calculated with maximum output current (${I_{CHG\left(MAX\right)}}$), maximum operational VIN, and output at the precondition threshold (${V_{BAT\left(PRE\right)},\thinspace or\thinspace 0.7•V_{BAT\left(FLT\right)}}$): ${I_{DIODE\left(MAX\right)}>I_{CHG\left(MAX\right)}•\frac{V_{IN\left(MAX\right)}-V_{BAT\left(PRE\right)}}{V_{IN\left(MAX\right)}}\left(A\right)}$
${I_{DIODE\left(MAX\right)}>0.4\cdot \frac{12-5.18}{12}}$
${I_{DIODE\left(MAX\right)}>0.2273\thinspace A}$
The output battery float voltage (VBAT(FLT)) is programmed by connecting a resistor divider from the BAT pin to VFB. VBAT(FLT) can be programmed up to 14.4V.
Using a resistor divider with an equivalent input resistance at the VFB pin of 250k compensates for input bias current error. Required resistor values to program desired VBAT(FLT) follow the equations:
The charge function operates to achieve the final float voltage of 3.3V on the VFB pin. The auto-restart feature initiates a new charging cycle when the voltage at the VFB pin falls 2.5% below that float voltage. Because the battery voltage is across the VBAT(FLT) programming resistor divider, this divider will draw a small amount of current from the battery (IRFB) at a rate of: IRFB = 3.3/RFB2
Precision resistors in high values may be hard to obtain, so for some lower VBAT(FLT) applications, it may be desirable to use smaller-value feedback resistors with an additional resistor (RFB3) to achieve the required 250k equivalent resistance. The resulting 3-resistor network, as shown in Figure 5, can ease component selection and/or increase output voltage precision, at the expense of additional current through the feedback divider.
${\frac{R_{FB2}}{R_{FB1}}=\frac{3.3}{\left(V_{BAT\left(FLT\right)}-3.3\right)}}$
${\frac{R_{FB2}}{R_{FB1}}=\frac{3.3}{\left(7.4-3.3\right)}=0.80487}$
Set the divider current (IRFB) = 10uA yields:
${R_{FB2}=\frac{3.3}{10uA}=330k}$
Solving for RFB1:
${R_{FB1}=\frac{330k}{0.80487}=410k}$
The divider equivalent resistance is:
${R_{FB1}||R_{FB2}=182.8k}$
To satisfy the 250k equivalent resistance to the VFB pin:
${R_{FB3}=250k-182.8k=67.2k}$
Because the VFB pin is a relatively high impedance node, stray capacitances at this pin must be minimized. Special attention should be given to any stray capacitances that can couple external signals onto the pin, which can produce undesirable output transients or ripple. Effects of parasitic capacitance can typically be reduced by adding a small-value (20pF to 50pF) feed forward capacitor from the BAT pin to the VFB pin
The LT3652 contains a voltage monitor pin that enables programming a minimum operational voltage. Connecting a resistor divider from VIN to the VIN_REG pin enables programming of minimum input supply voltage, typically used to program the peak power voltage for a solar panel. Maximum charge current is reduced when the VIN_REG pin is below the regulation threshold of 2.7V. If an input supply cannot provide enough power to satisfy the requirements of an LT3652 charger, the supply voltage will collapse. A minimum operating supply voltage can thus be programmed by monitoring the supply through a resistor divider, such that the desired minimum voltage corresponds to 2.7V at the VIN_REG pin. The LT3652 servos the maximum output charge current to maintain the voltage on VIN_REG at or above 2.7V. Programming of the desired minimum voltage is accomplished by connecting a resistor divider as shown in Figure 6. The ratio of RIN1/RIN2 for a desired minimum voltage (VIN(MIN)) is:
${\frac{R_{IN1}}{R_{IN2}}=\left(\frac{V_{IN\left(MIN\right)}}{2.7}\right)-1}$
If the voltage regulation feature is not used, connect the VIN_REG pin to VIN.
For my configuration I will set the ${V_{IN\left(MIN\right)}}$ as 10V
${\frac{R_{IN1}}{R_{IN2}}=\frac{10}{2.7}-1=2.7037}$
${R_{IN1}=270k}$
${R_{IN2}=100k}$
See Page 16 of the datasheet for MPPT temperature compensation and battery voltage temperature compensation
In this design I opted to ignore the following features to simplify the design. Nevertheless, these features are actually very easy to work with and are well documented within the datasheet.
The LT3652 reports charger status through two open collector outputs, the CHRG and FAULT pins. These pins can accept voltages as high as VIN, and can sink up to 10mA when enabled. The CHRG pin indicates that the charger is delivering current at greater that a C/10 rate, or 1/10th of the programmed maximum charge current. The FAULT pin signals bad battery and NTC faults.
If the battery is removed from an LT3652 charger that is configured for C/10 termination, a sawtooth waveform of approximately 100mV appears at the charger output, due to cycling between termination and recharge events, This cycling results in pulsing at the CHRG output. An LED connected to this pin will exhibit a blinking pattern, indicating to the user that a battery is not present. The frequency of this blinking pattern is dependent on the output capacitance.
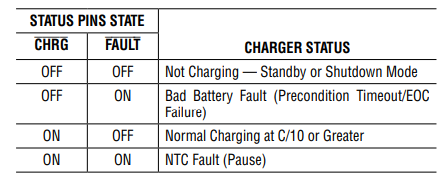
Status Pins Table
The LT3652 supports a low-current based termination scheme, where a battery charge cycle terminates when the current output from the charger falls to below one-tenth of the maximum current, as programmed with RSENSE. The C/10 threshold current corresponds to 10mV across RSENSE. This termination mode is engaged by shorting the TIMER pin to ground. When C/10 termination is used, a LT3652 charger will source battery charge current as long as the average current level remains above the C/10 threshold. As the full-charge float voltage is achieved, the charge current falls until the C/10 threshold is reached, at which time the charger terminates and the LT3652 enters standby mode. The CHRG status pin follows the charger cycle, and is high impedance when the charger is not actively charging. When VBAT drops below 97.5% of the full-charged float voltage, whether by battery loading or replacement of the battery, the charger automatically re-engages and starts charging. There is no provision for bad battery detection if C/10 termination is used.
A schottky diode is placed at the output of a solar panel primarily to prevent reverse current flow, which can discharge the battery at night or during low-light conditions. For this schottky diode I had originally chosen the B5817WS-TP. One thing to consider is the thermal performance of this diode.
According to the datasheet, we expect this to operate with an average forward voltage drop of 0.45V. We also expect it to sink 350mA at the solar panel's peak performance.
${P=V\cdot I=0.45\cdot 0.350=0.1575\ Watts}$
According to the datasheet the maximum thermal resistance is 500°C/W from junction to ambient. Therefore we would expect the diode to rise above ambient temperature by:
${T=500°C/W\cdot 0.1575W=78.75°C}$
While this is technically within the operating specifications of the diode, it would be wise to consider a diode with superior thermal performance to prevent potential thermal runaway.
As such, a suitable alternative with a slightly larger case size would be the SMD22PL-TP. By using the same calculations as above, we can expect the following power dissipation:
${P=V\cdot I=0.5\cdot 0.350=0.175\ Watts}$
${T=115°C/W\cdot 0.175W=20.125°C}$
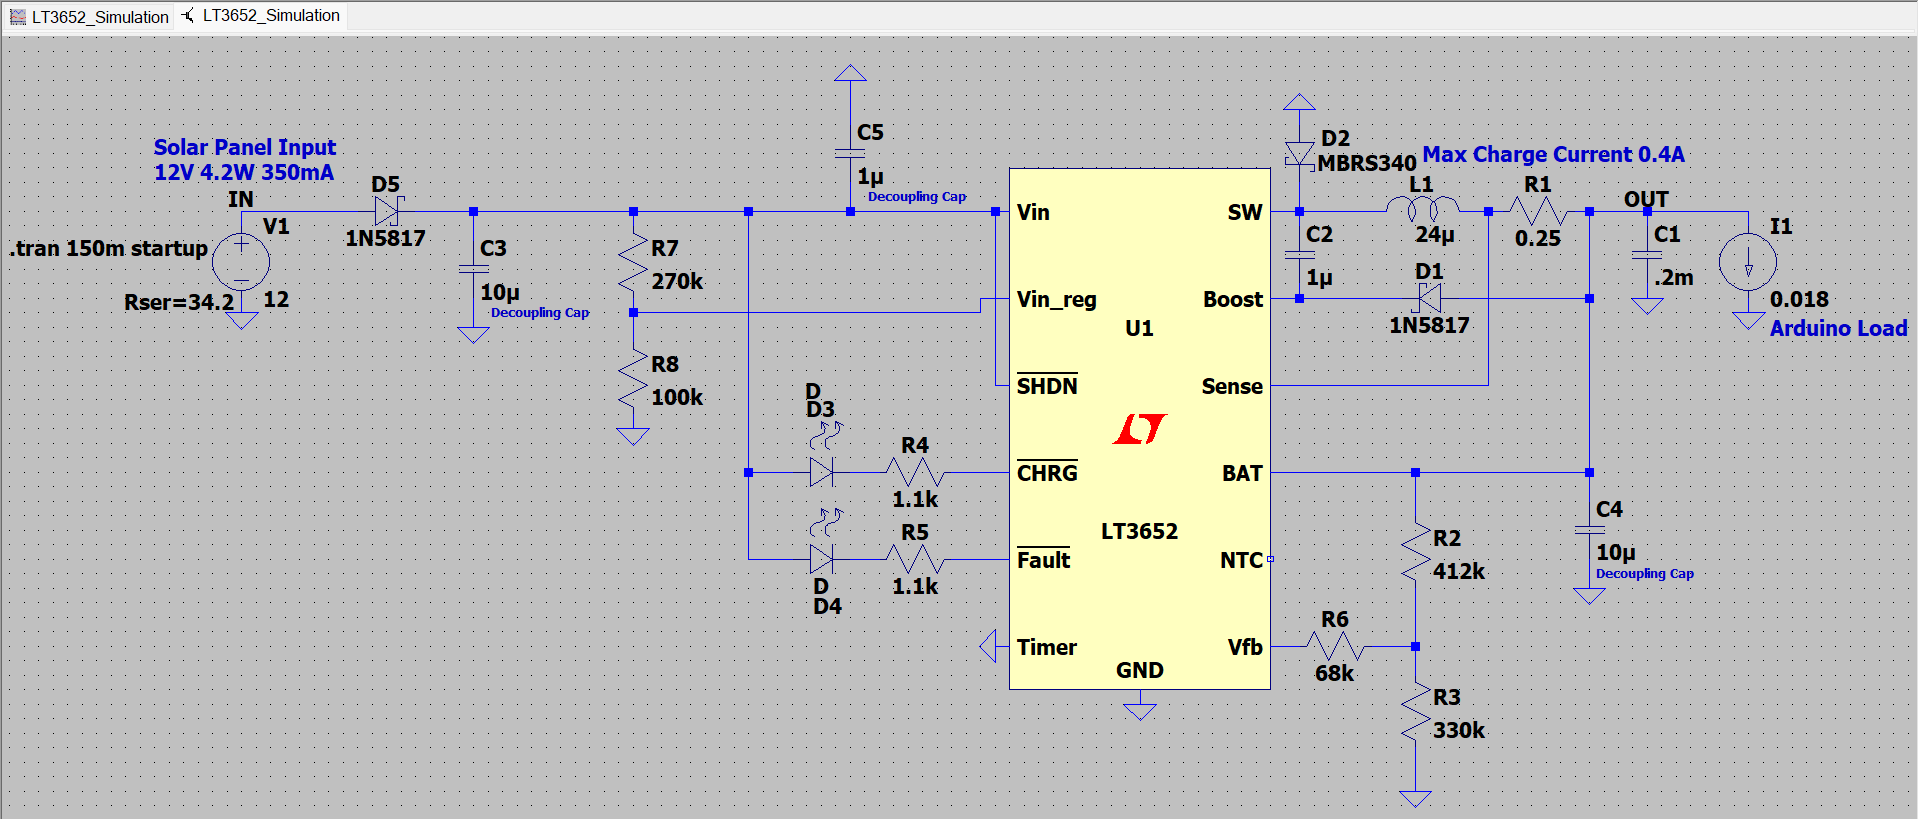
LTSpice Schematic Capture
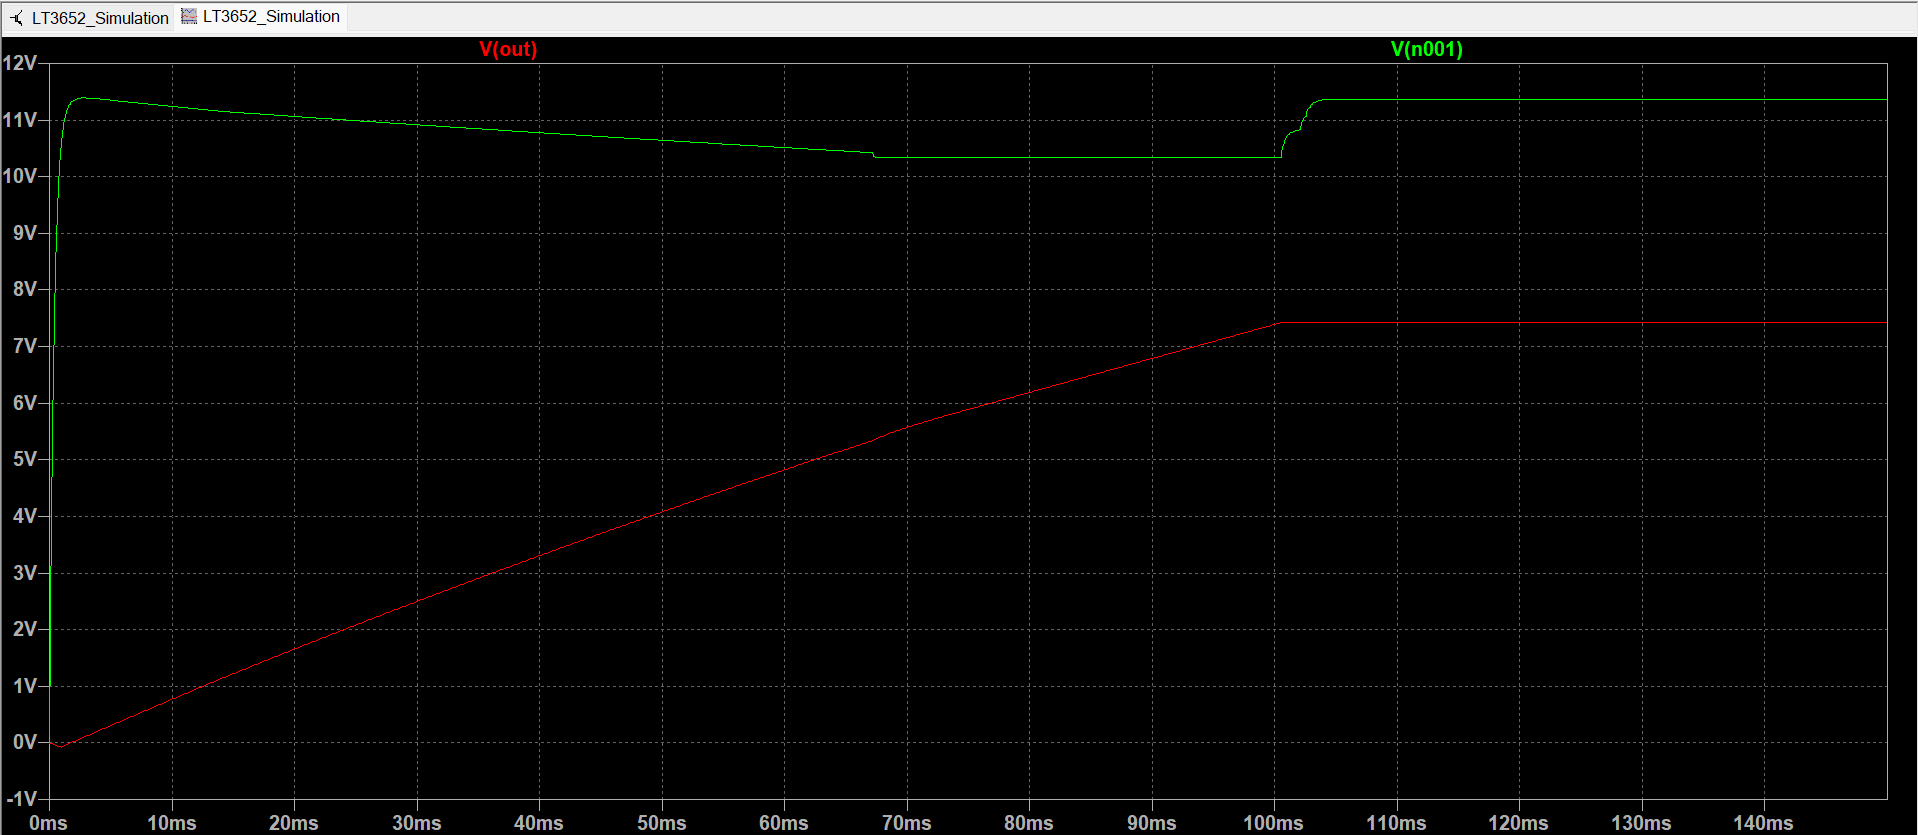
LTSpice Charge Simulation 0% --> 100% (Vin vs Vout)
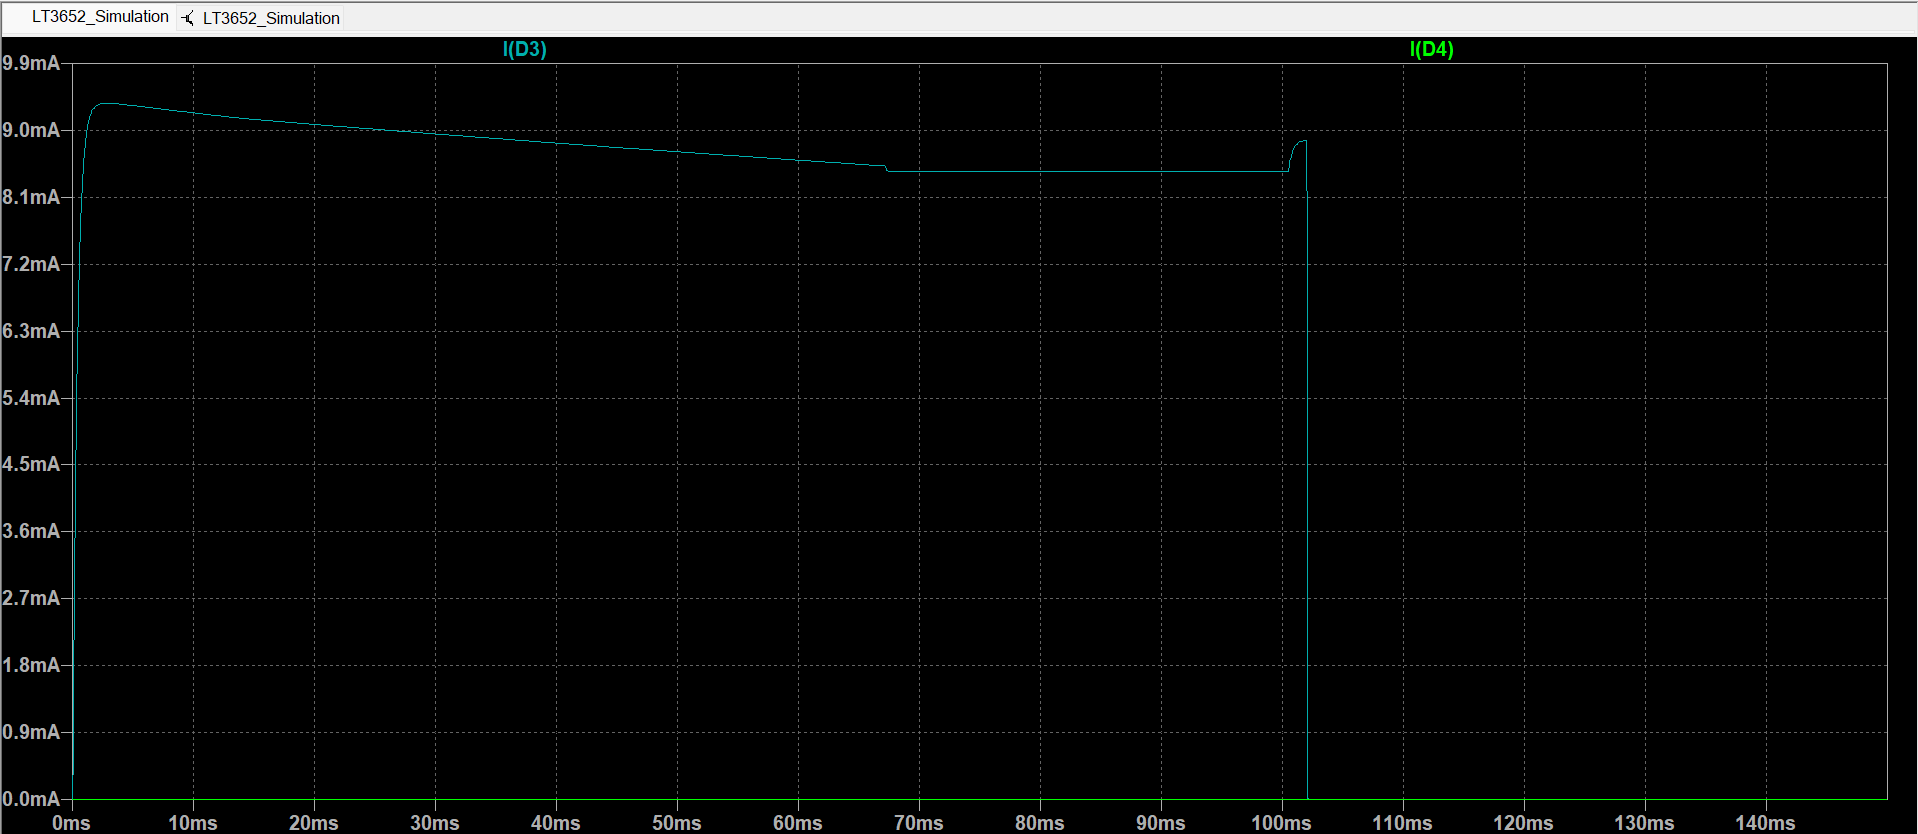
LTSpice CHG LED Status
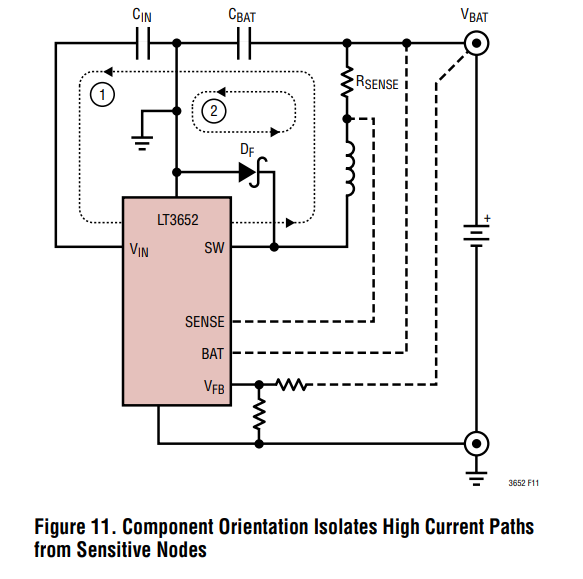
Layout power loops
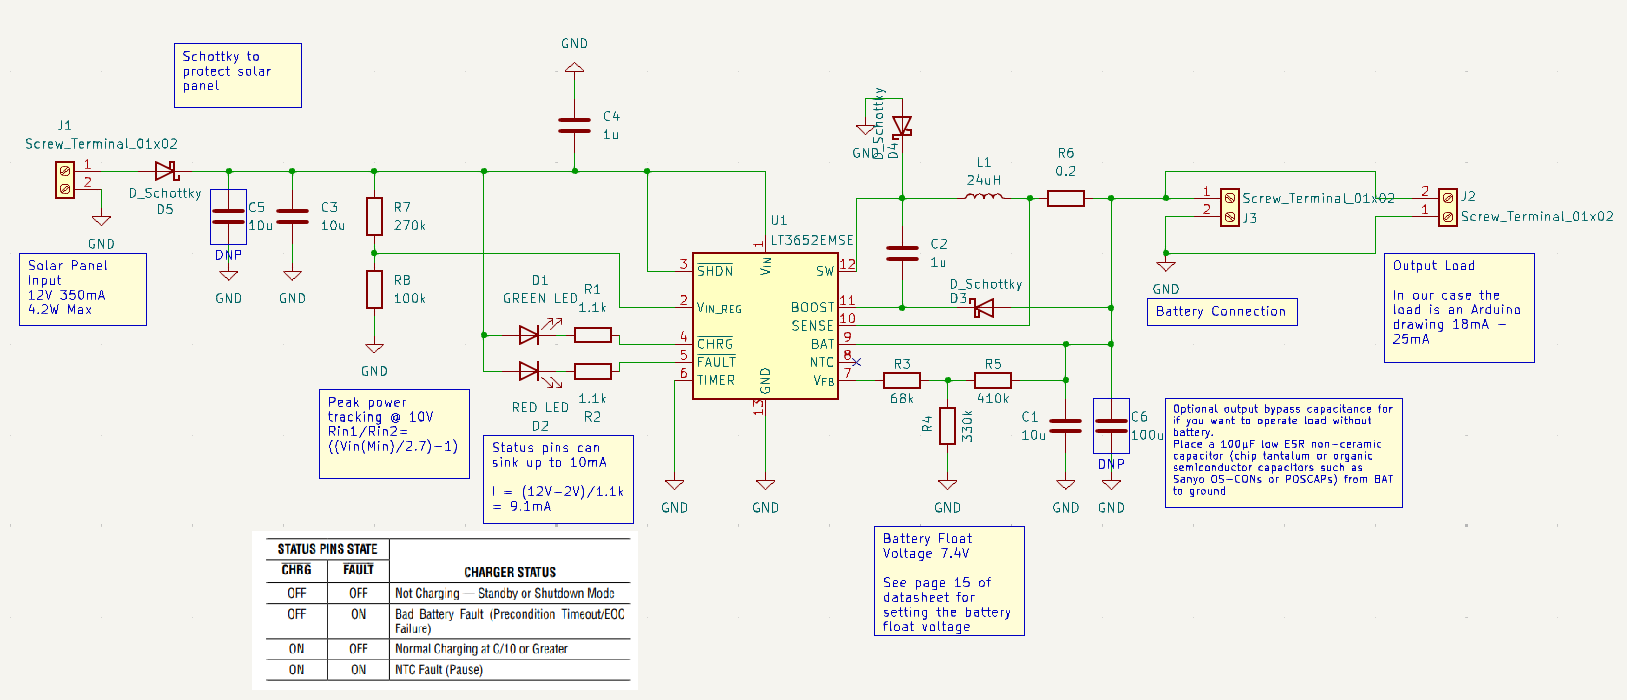
Schematic Design
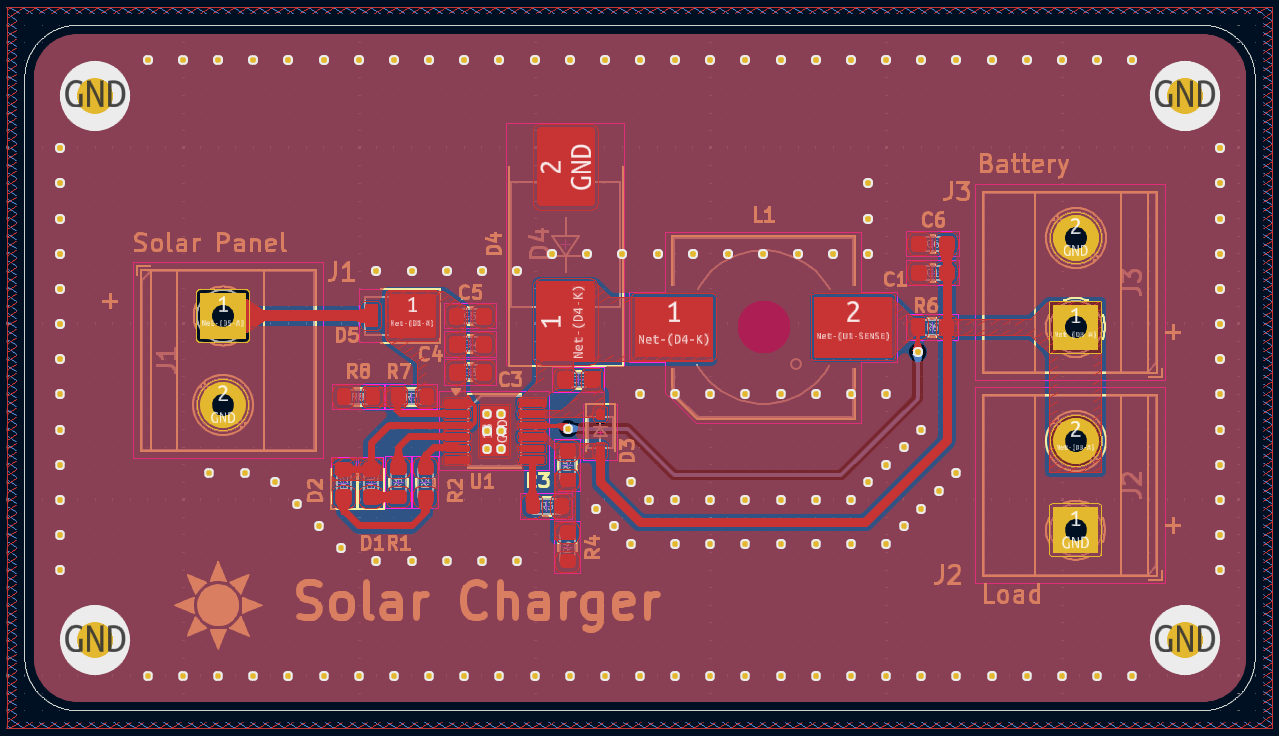
PCB Design
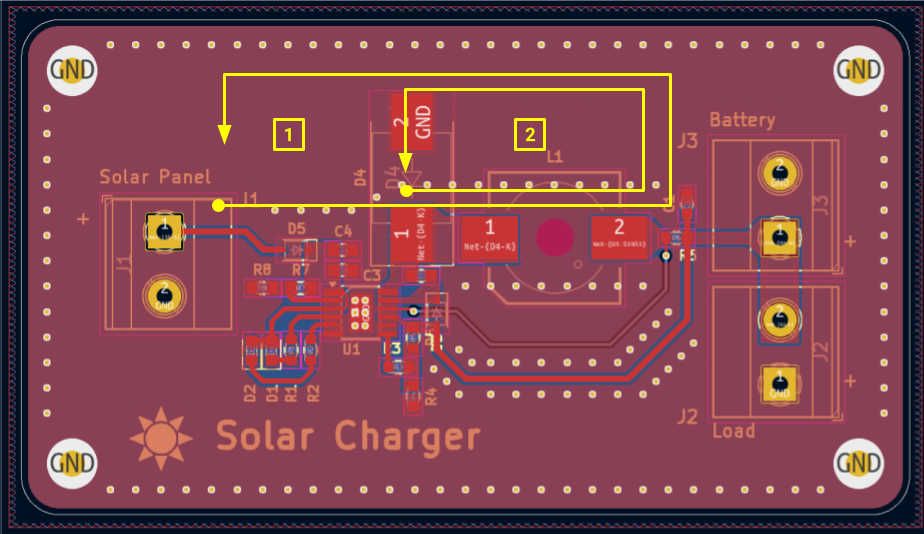
Layout power loops
I ordered the board through PCBWay by using the KiCAD plugin. I assembled and soldered the components on the board myself.
For the PCBWay specification selection I chose the following options:
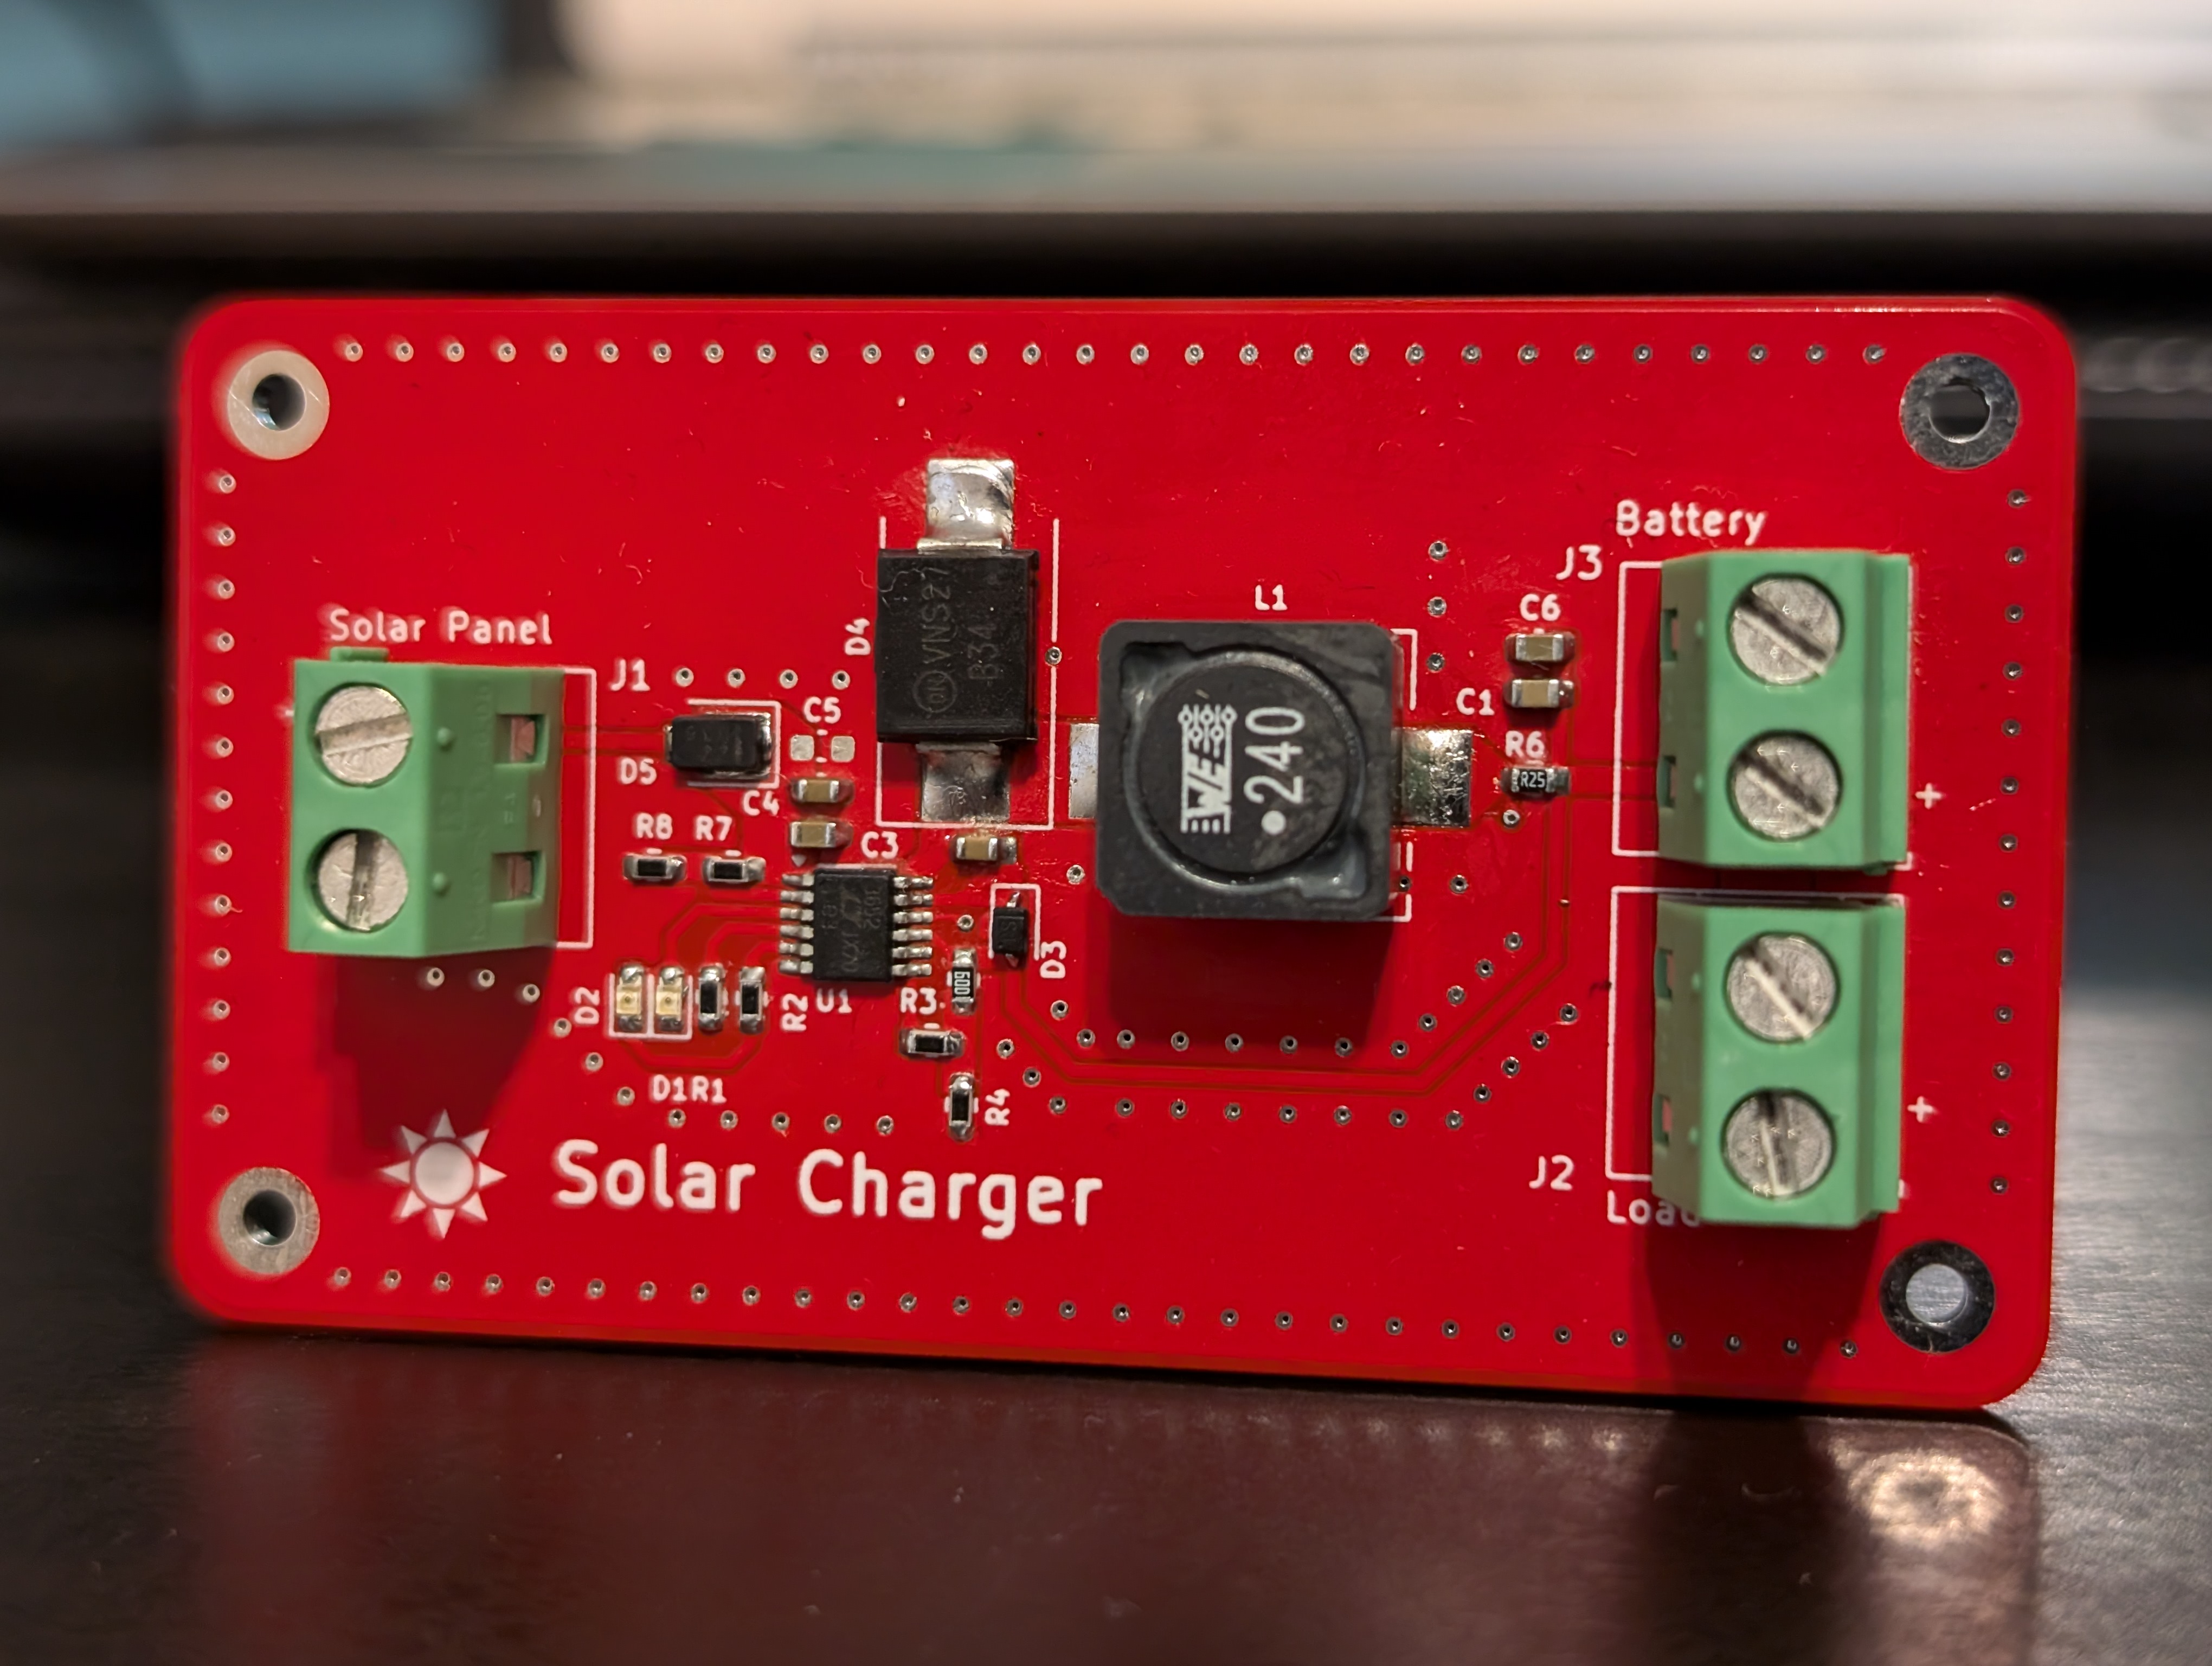
Final Product
Finally, I wanted to characterize the response of the circuit using my Analog Discovery 2 - USB oscilloscope. For my initial test setup, I connected the power input of the PCB to a power supply, configuring it to deliver 12V while limiting the current to 300mA. Additionally, I connected a pair of lithium-ion batteries to the PCB, which were discharged to approximately 7V.
To assess the circuit's output efficiency, I conducted the following calculations based on the input and output power.
${P=V\cdot I=12V\cdot 0.275A=3.3W}$
${P=V\cdot I=7.4\cdot 0.403A=2.9822W}$
${ \text{Efficiency} = \frac{P_{\text{out}}}{P_{\text{in}}} \cdot 100 = \frac{2.9822}{3.3} \cdot 100 = 0.9036 \cdot 100 = 90.4\% }$
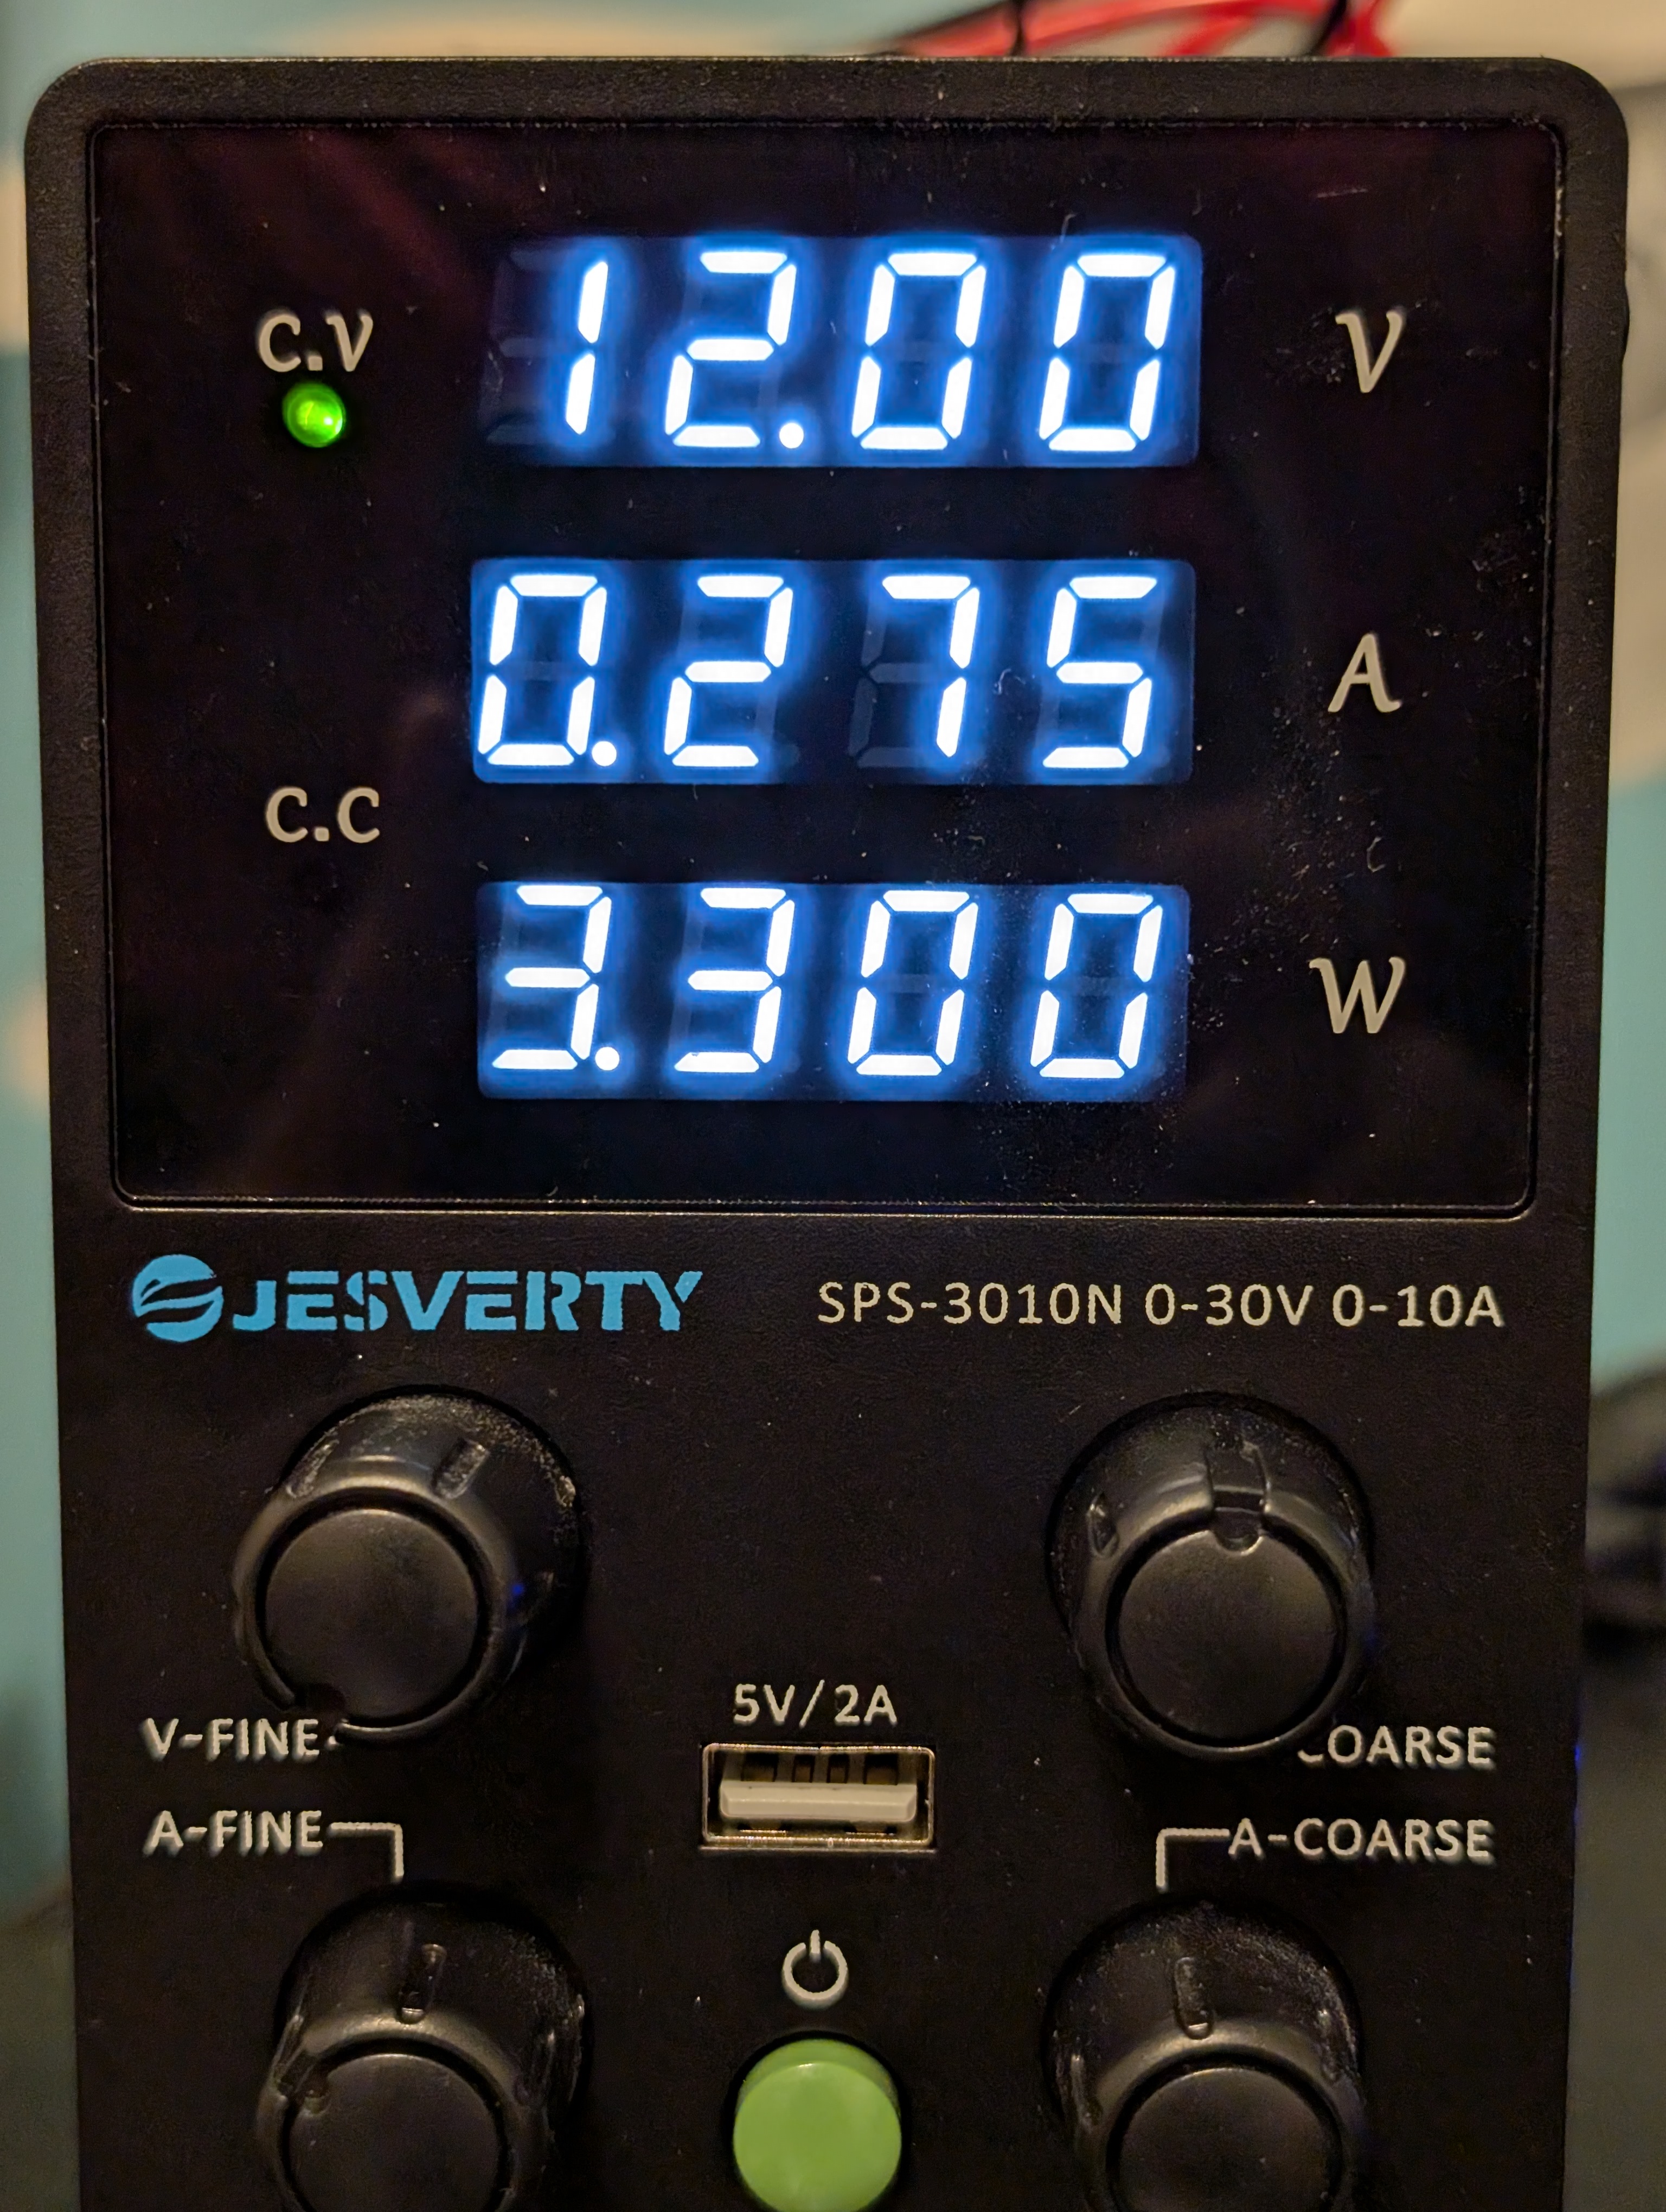
Input Power
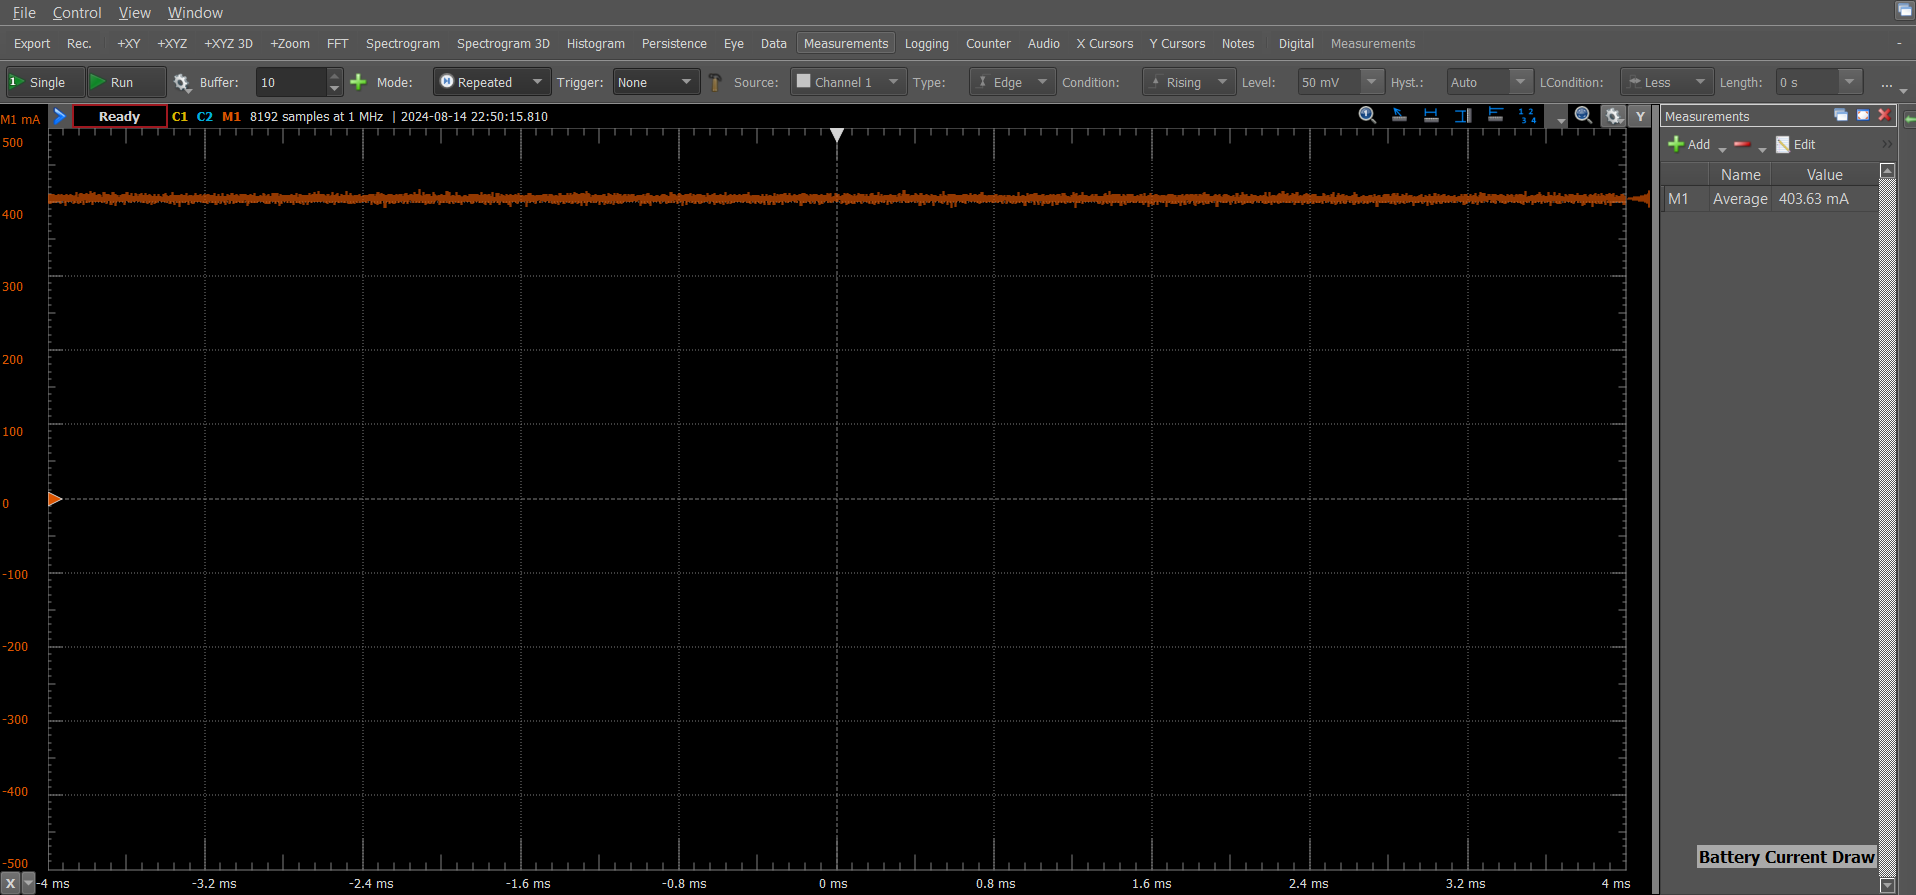
Output Current
I had the opportunity to conduct thermal imaging on the PCB during its operation by utilizing a FLIR thermal camera. As shown in the image, the primary hotspots were the input diode, battery management IC, and LED indicators. After approximately five minutes of operation at room temperature, the system began to stabilize, with peak temperatures reaching 52.4 degrees Celsius.
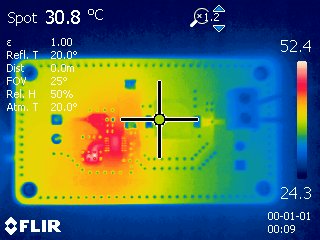
Thermal Image
The output voltage is well-centered around 7.4V, and the signal is generally acceptable. However, there are a few important observations to consider. First, there are ringing transients at the beginning of each recovery cycle of the converter. Second, the output ripple voltage is approximately 80mV. While this is within an acceptable range, it is slightly higher than desired. To reduce the output voltage ripple in a buck converter, consider selecting inductors with low parasitic capacitance and appropriate inductance values. Additionally, choose output capacitors with low equivalent series resistance (ESR) and equivalent series inductance (ESL). Increasing the output capacitance can also significantly suppress voltage ripple, thereby enhancing overall performance.
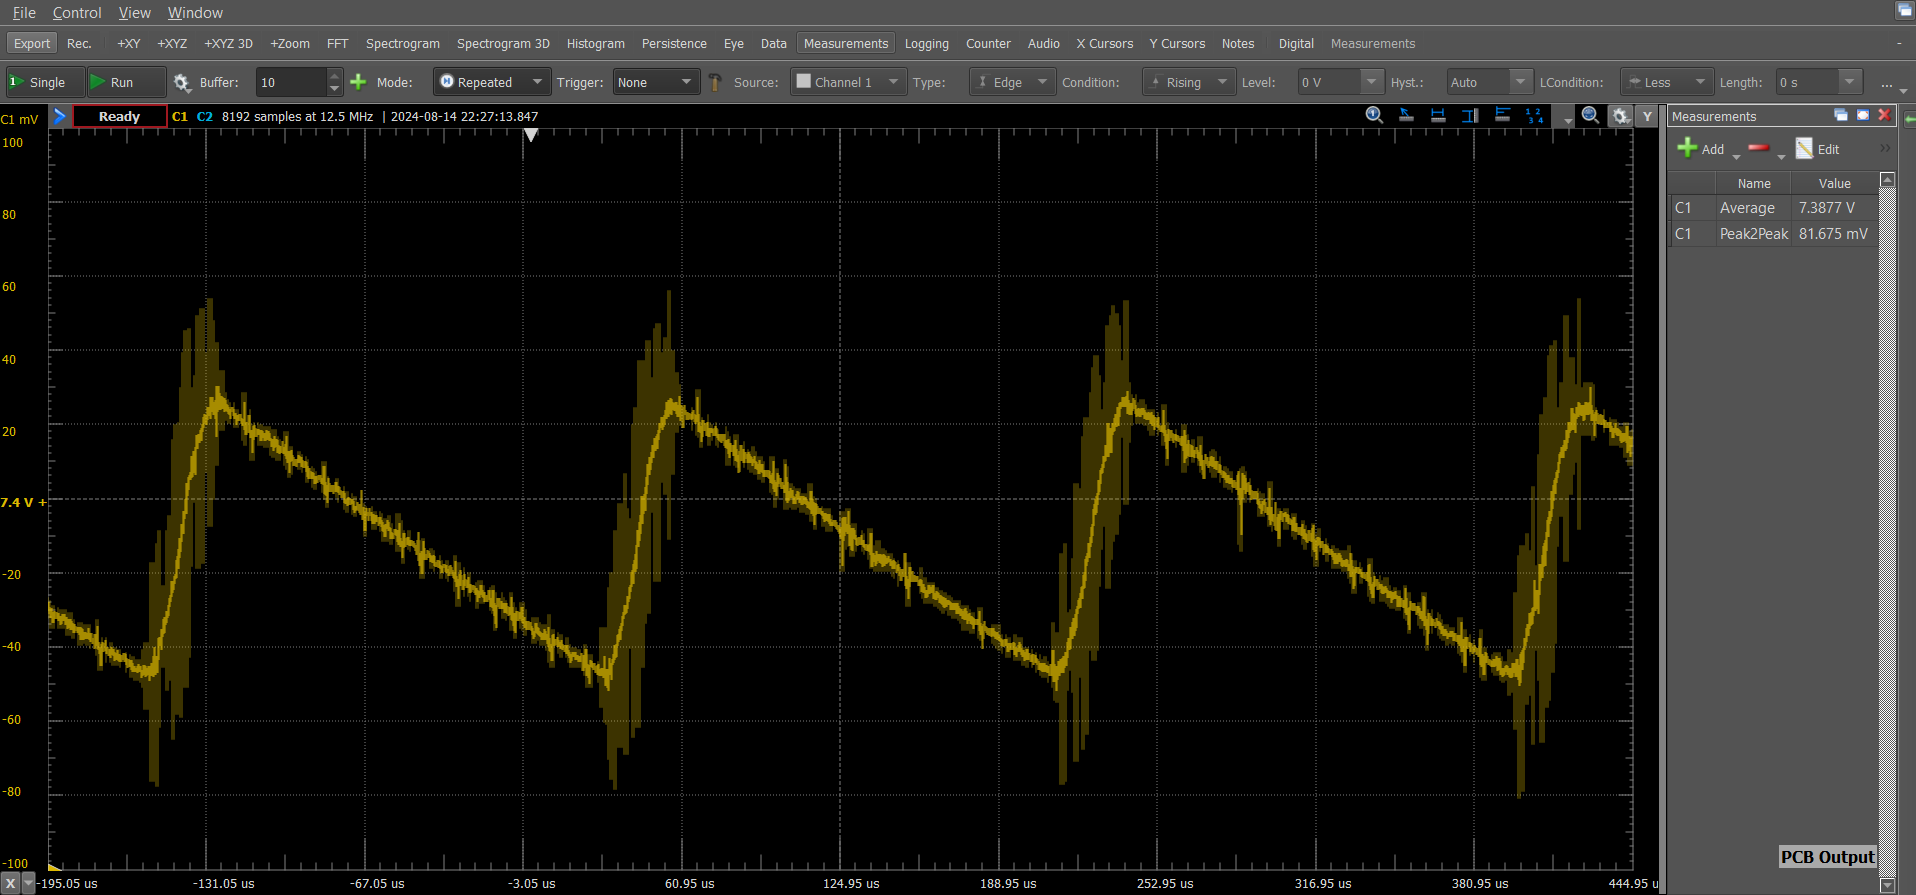
Output Voltage
You can observe the switching node in the image below. As specified in the datasheet, the switching frequency is 1 MHz. Furthermore, as mentioned in the previous section, the same ringing transient is evident at both the rising and falling edges of the signal. Ringing on the switching node of a buck converter is primarily caused by parasitic inductances and capacitances. The ringing occurs when the high-side switch turns on, and the energy stored in parasitic inductances is released, interacting with parasitic capacitances to create an LC tank circuit. In boost converters, the critical component regarding ringing is often the boost diode, and its characteristics can significantly influence the ringing behavior. You can do the following to reduce switch node ringing:
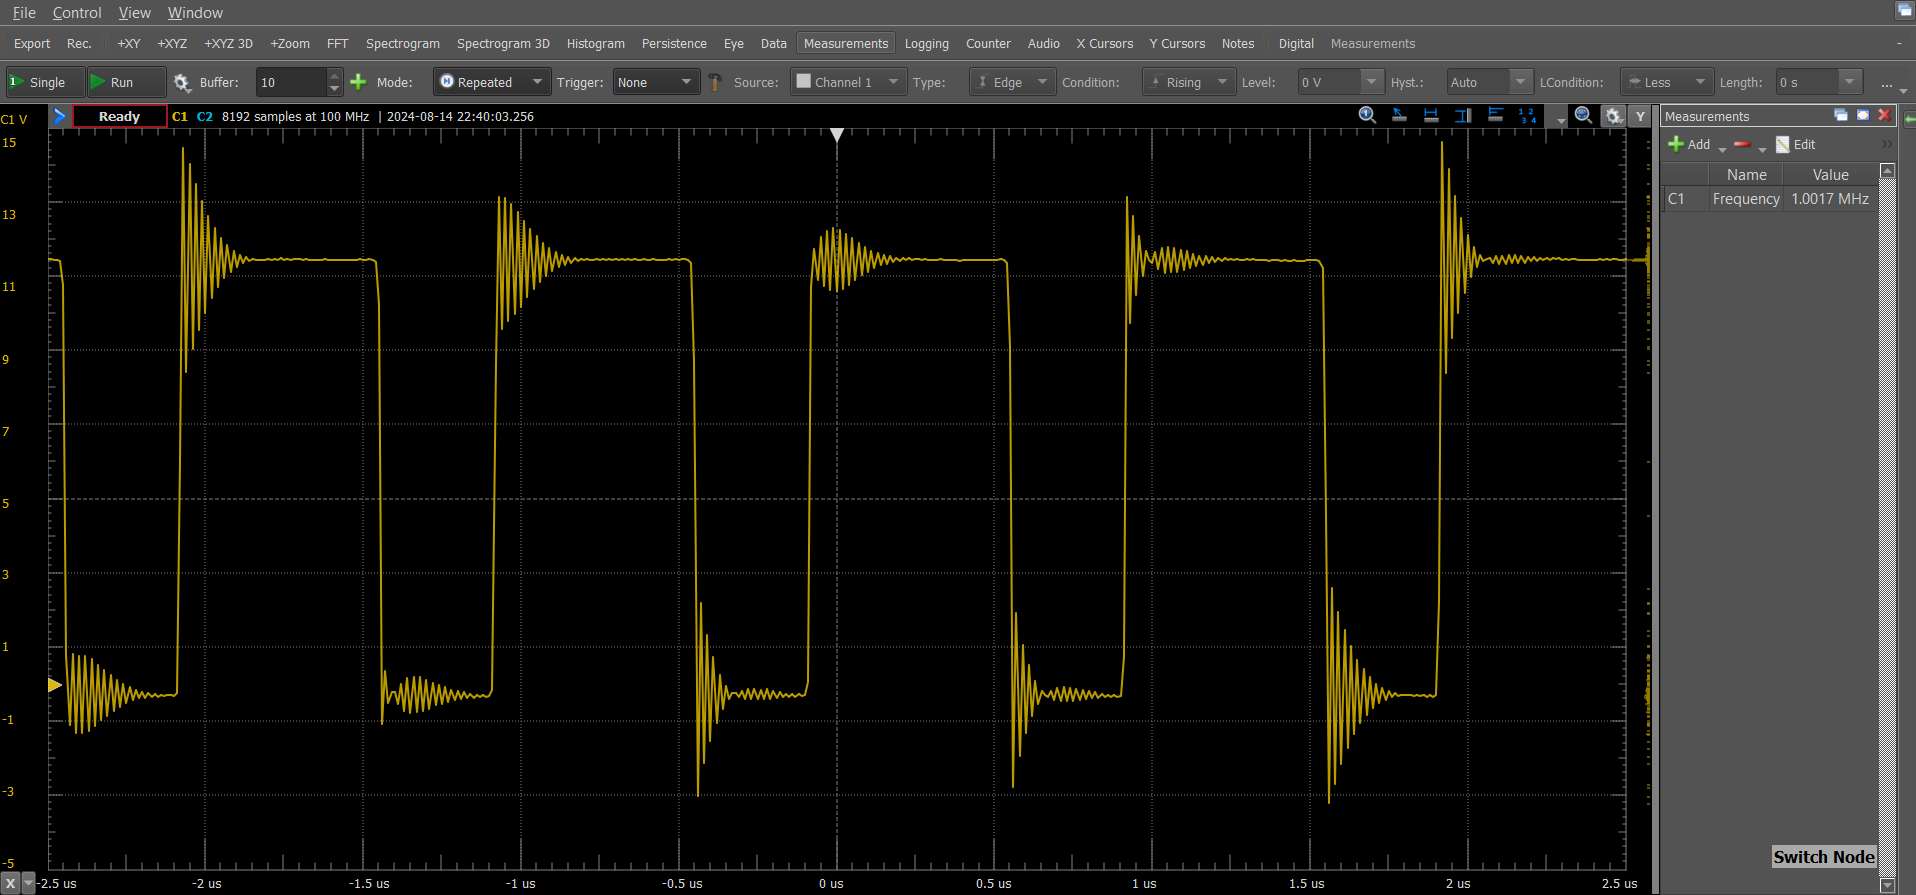
Switching Node
[!CAUTION] To investigate the source of the ringing observed in earlier measurements, I recaptured the switching node waveform using a Tektronix MSO44B oscilloscope with 1.5 GHz bandwidth and 12-bit resolution. In this capture, the ringing was no longer present, which highlighted that the Analog Discovery 2's 10 MHz analog bandwidth was not sufficient to accurately capture the characteristics of fast digital transitions with rise times around 25 ns—as was mentioned by @JoshMuir. Accurately observing such transitions requires significantly higher bandwidth, typically at least three times the frequency content of the fastest signal components. The earlier distortion was likely due to this limitation, along with some stray inductance in the probe setup.
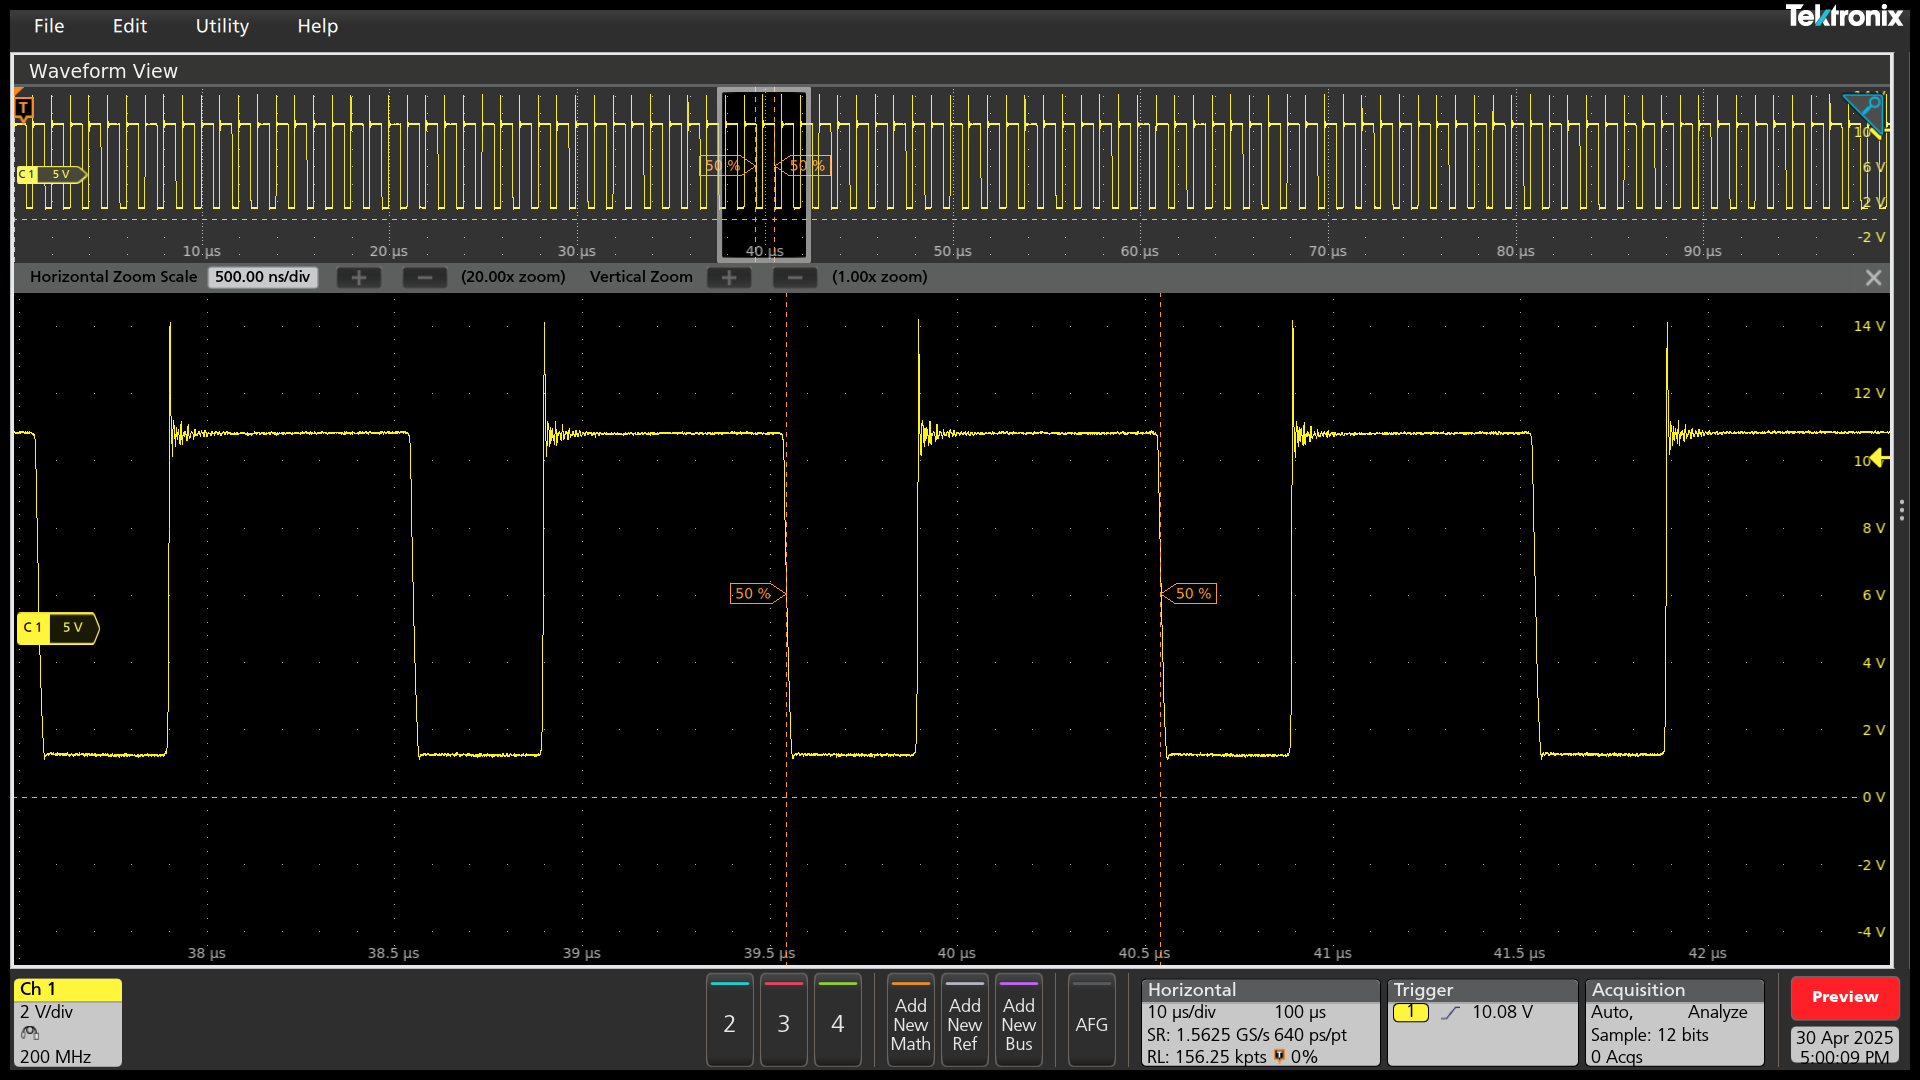
Switching Node on Tektronix MS044B
For one of my final test setup, I connected the solar panel, lithium-ion battery pack, and Arduino to the PCB, then placed it in the bright sunlight around noon. On that day, a thin layer of clouds softened the sun's rays. I slightly discharged the battery to approximately 6.8V and set the Arduino to operate in a low-power state using the Narcoleptic library. During this time, the solar panel was able to produce 12V at around 172mA. After connecting everything, I turned off the battery switch and measured the current draw of the Arduino by placing a multimeter in series with it. During its low-power sleep mode, the Arduino was drawing 22.7mA of current. This slightly differs from our initial measurements of the Arduino in low-power mode, which can be attributed to minor errors in the measurement instruments. Finally, I turned on the battery switch and allowed the entire system to run. The Arduino remained powered on, executing its software while the battery charged slowly. I measured the current flowing into both the battery and the Arduino by probing the voltage across the 0.25-ohm sense resistor. The voltage drop was 53.2mV, indicating that both were consuming a total of 212.8mA. During full operation, the charge LED was illuminated, indicating that the circuit was functioning correctly and that the batteries were charging.
To assess the circuit's output efficiency during operating, I conducted the following calculations based on the input and output power.
${P=V\cdot I=10.21V\cdot 0.172A=1.756W}$
The input voltage from the solar panel was measured at 10.21V instead of the expected 12V, which is attributed to the programmed peak power voltage configured with a voltage divider for the V_In_Reg pin.
${P=V\cdot I=7.4\cdot 0.2128A=1.575W}$
${ \text{Efficiency} = \frac{P_{\text{out}}}{P_{\text{in}}} \cdot 100 = \frac{1.575}{1.756} \cdot 100 = 0.896 \cdot 100 = 89.6\% }$
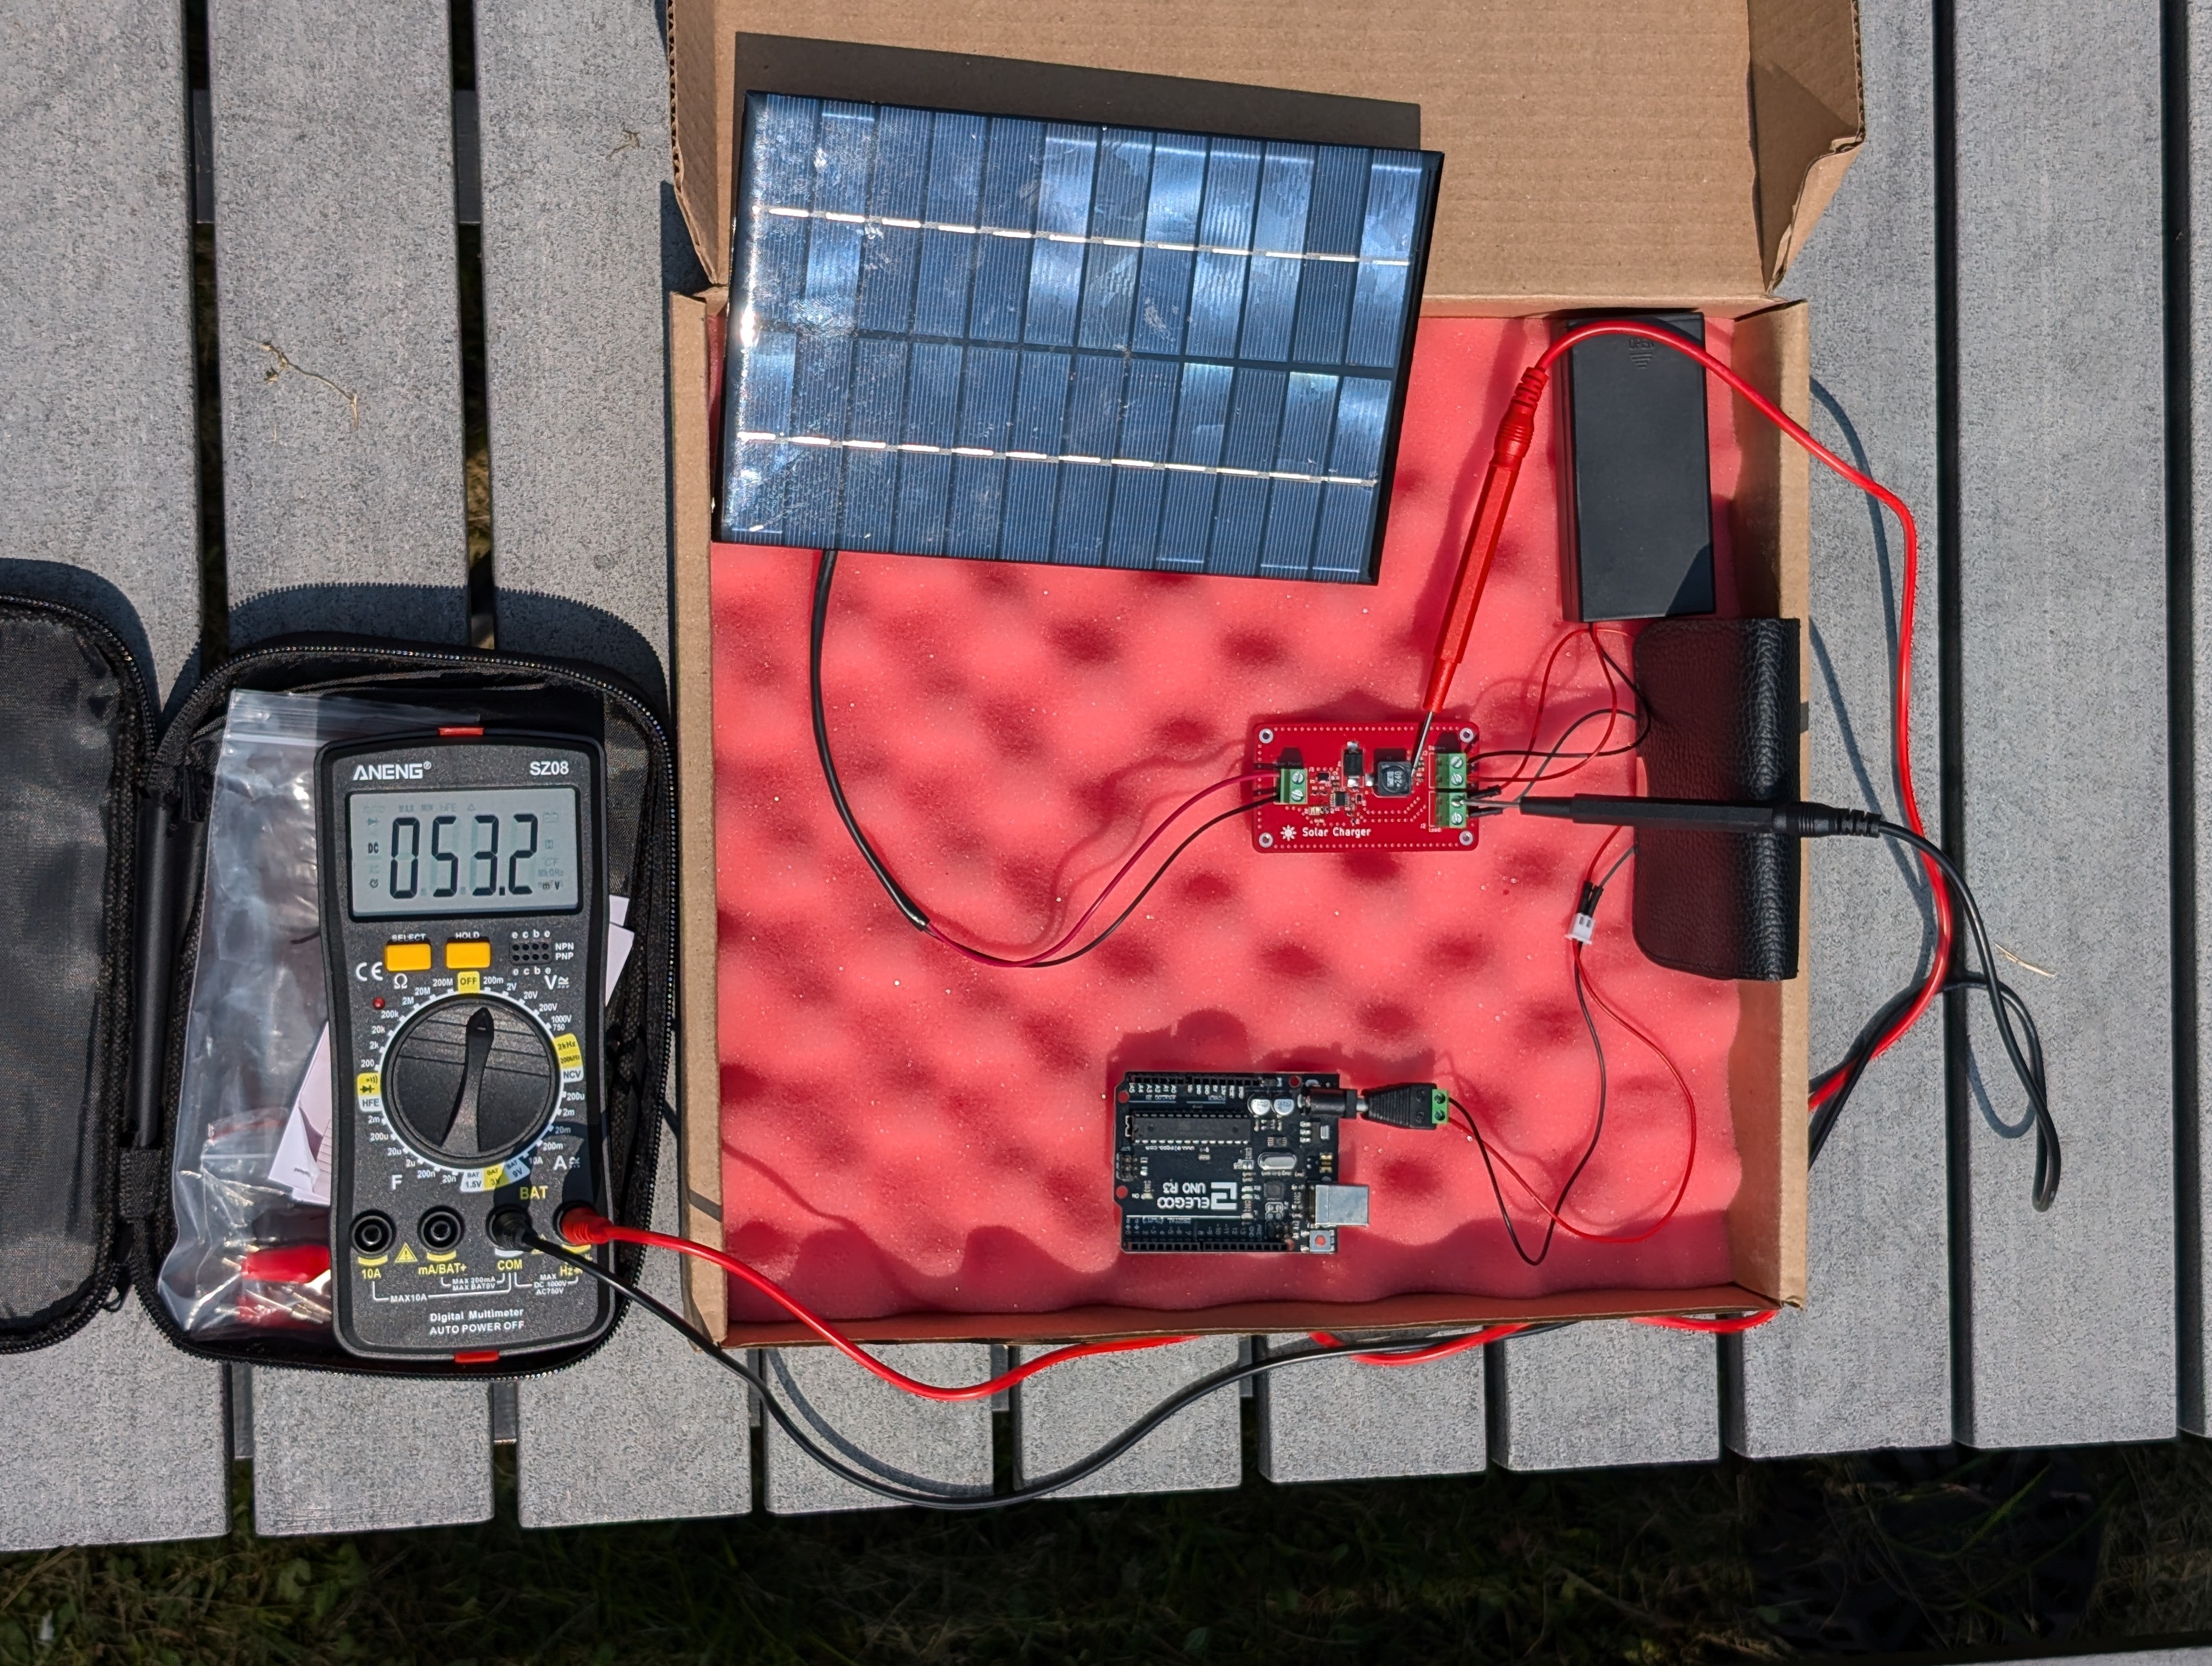
Solar Test
For one of my final test setups, I connected the solar panel, lithium-ion battery pack, and Arduino to the PCB. Then, I connected my Analog Discovery 2 USB oscilloscope to the battery terminals and solar panel terminals. Finally, I taped the solar panel to my room window and began my scope capture at 3 AM. I ran the scope capture from 3 AM to 11:30 PM to characterize the circuit's response during an entire day of sun exposure. On this day, there were clear skies and approximately 12 hours of bright sunshine. The battery was nearly full at the beginning of the test, so throughout the day, minimal charging occurred.
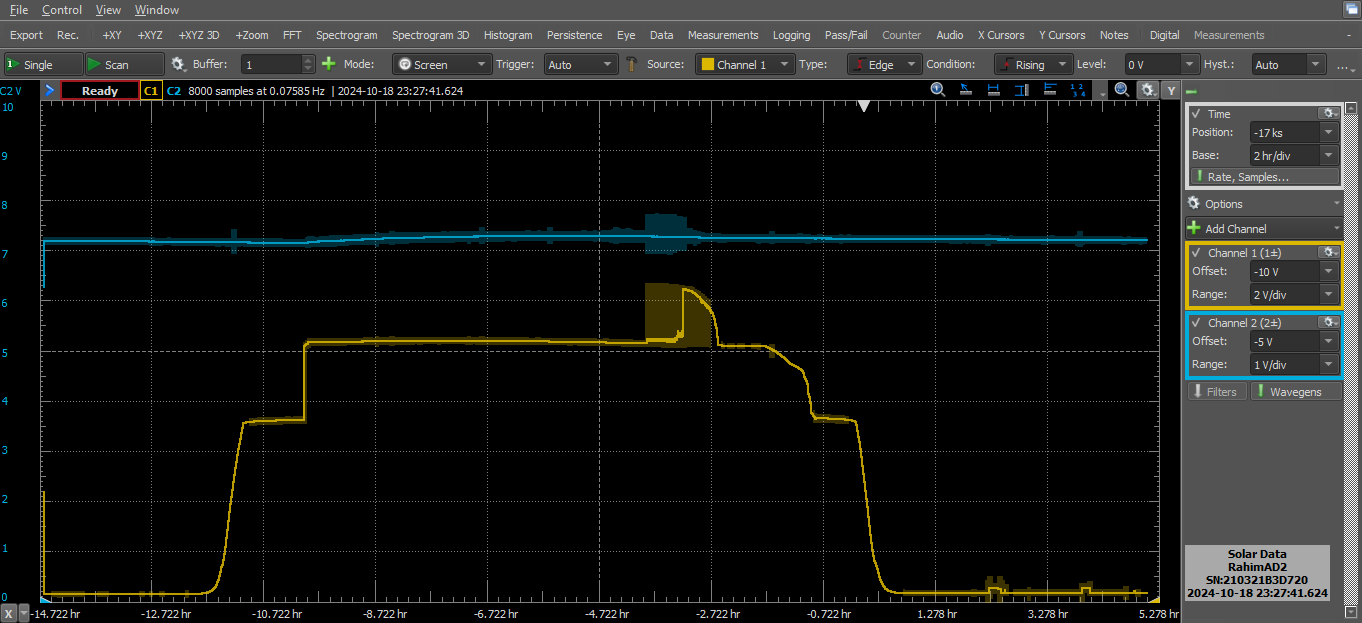
Extended Solar Test
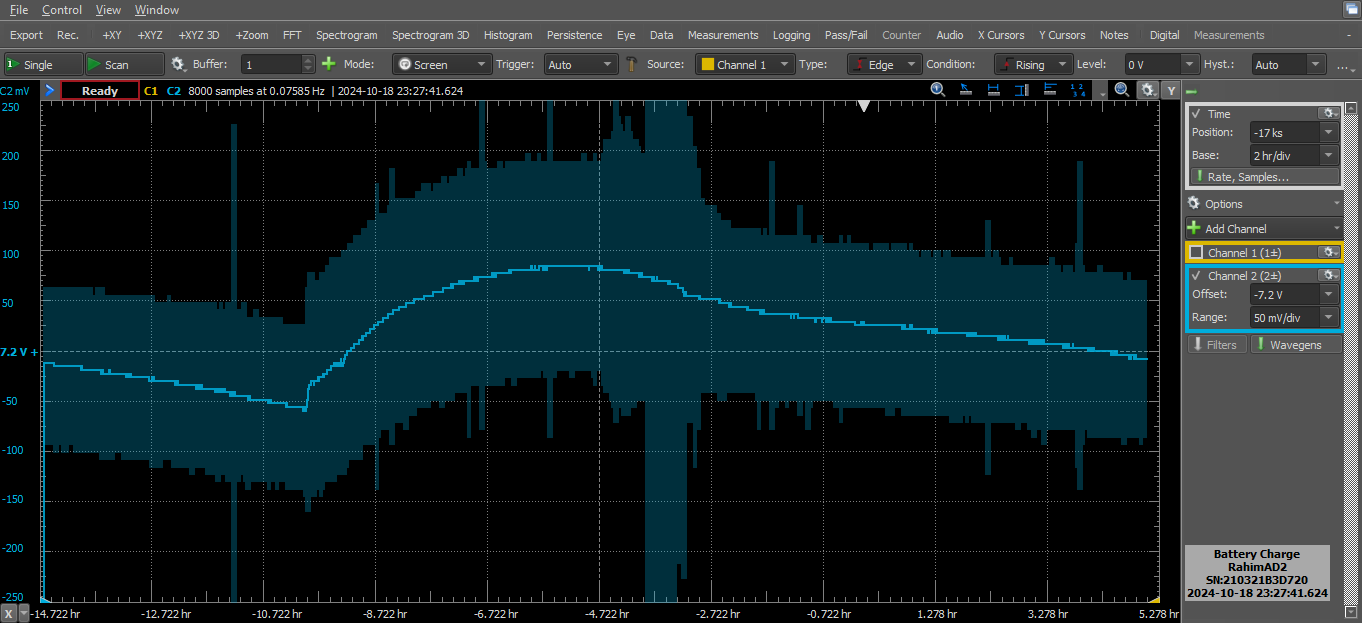
Extended Solar Test
| Qty | Value | Footprint | References |
|---|---|---|---|
| 3 | 10u | Capacitor_SMD:C_0603_1608Metric | C1, C3, C5 |
| 3 | Screw_Terminal_01x02 | TerminalBlock_Phoenix:TerminalBlock_Phoenix_MKDS-1,5-2-5.08_1x02_P5.08mm_Horizontal | J1, J2, J3 |
| 2 | 1.1k | Resistor_SMD:R_0603_1608Metric | R1, R2 |
| 2 | 1u | Capacitor_SMD:C_0603_1608Metric | C2, C4 |
| 1 | 0.2 | Resistor_SMD:R_0603_1608Metric | R6 |
| 1 | 100k | Resistor_SMD:R_0603_1608Metric | R8 |
| 1 | 100u | Capacitor_SMD:C_0603_1608Metric | C6 |
| 1 | 24uH | Inductor_SMD:L_Wuerth_WE-PDF_Handsoldering | L1 |
| 1 | 270k | Resistor_SMD:R_0603_1608Metric | R7 |
| 1 | 330k | Resistor_SMD:R_0603_1608Metric | R4 |
| 1 | 410k | Resistor_SMD:R_0603_1608Metric | R5 |
| 1 | 68k | Resistor_SMD:R_0603_1608Metric | R3 |
| 1 | D_Schottky | Diode_SMD:D_SMC_Handsoldering | D4 |
| 1 | D_Schottky | Diode_SMD:D_SMP_DO-220AA | D5 |
| 1 | D_Schottky | Diode_SMD:D_SOD-323 | D3 |
| 1 | GREEN LED | LED_SMD:LED_0603_1608Metric | D1 |
| 1 | LOGO | LOGO | G*** |
| 1 | LT3652EMSE | Package_SO:MSOP-12-1EP_3x4mm_P0.65mm_EP1.65x2.85mm | U1 |
| 1 | RED LED | LED_SMD:LED_0603_1608Metric | D2 |
Kampi/SensorHub
Solar-powered, low energy environment sensor node with WiFi interface.


kwiecinski/BMS-and-offgrid-photovoltaic-management-system
Project contains BMS for lead-acid batteries and ESP-based board used to pull information from EASUN offgrid inverter, energy meters and sensors.


google/mozc-devices
Circuit diagrams and firmware source code for Gboard DIY keyboards

davidphilipbarr/Sweep
Sweep - a small promicro based keyboard inspired by the Ferris.
It measures 70 × 39 mm and has 2 copper layers, 1.6 mm thick.
25 parts, built around the LT3652EMSE#PBF. The full list of its parts is on this page, with links to each part's symbol and footprint where PCBKit's library has them.
From the Raziz1/Solar_PCB repository on GitHub, at the commit this page was made from: the board is Solar_PCB_KiCad/Solar_PCB_KiCad.kicad_pcb and its schematic KiCAD_Custom_DRC_Rules_for_PCBWay/KiCAD_Custom_DRC_Rules_for_PCBWay/KiCAD_Custom_DRC_Rules_for_PCBWay.kicad_sch. PCBKit opens the board in the browser, with nothing to install.
Its repository states no licence, so its author keeps all rights: ask Raziz1 before reusing the design.