2 layers19 × 76 mm
Sub
google/mozc-devices
Circuit diagrams and firmware source code for Gboard DIY keyboards
15 parts3kApache-2.0

 ionutz04/REST-API_Meteo_Station1
A complete, end-to-end IoT weather station built from scratch: custom PCB, FreeRTOS firmware on an ESP32, a containerised backend on an NVIDIA Jetson Orin Nano, a multi-head LSTM forecasting pipeline, a Grafana…
Meteo station is an open-source printed circuit board by ionutz04, from the ionutz04/REST-API_Meteo_Station repository on GitHub. It is a 2-layer board of 38.8 × 67 mm with 15 parts on 49 nets, routed with 107 tracks and 19 vias.
Its parts include 6 resistors, 5 connectors, 3 capacitors and 1 IC. It belongs with the ESP32 boards of this library.
A complete, end-to-end IoT weather station built from scratch: custom PCB, FreeRTOS firmware on an ESP32, a containerised backend on an NVIDIA Jetson Orin Nano, a multi-head LSTM forecasting pipeline, a Grafana dashboard, and a Flutter mobile app. The system has been running continuously and autonomously since 14 April 2026.
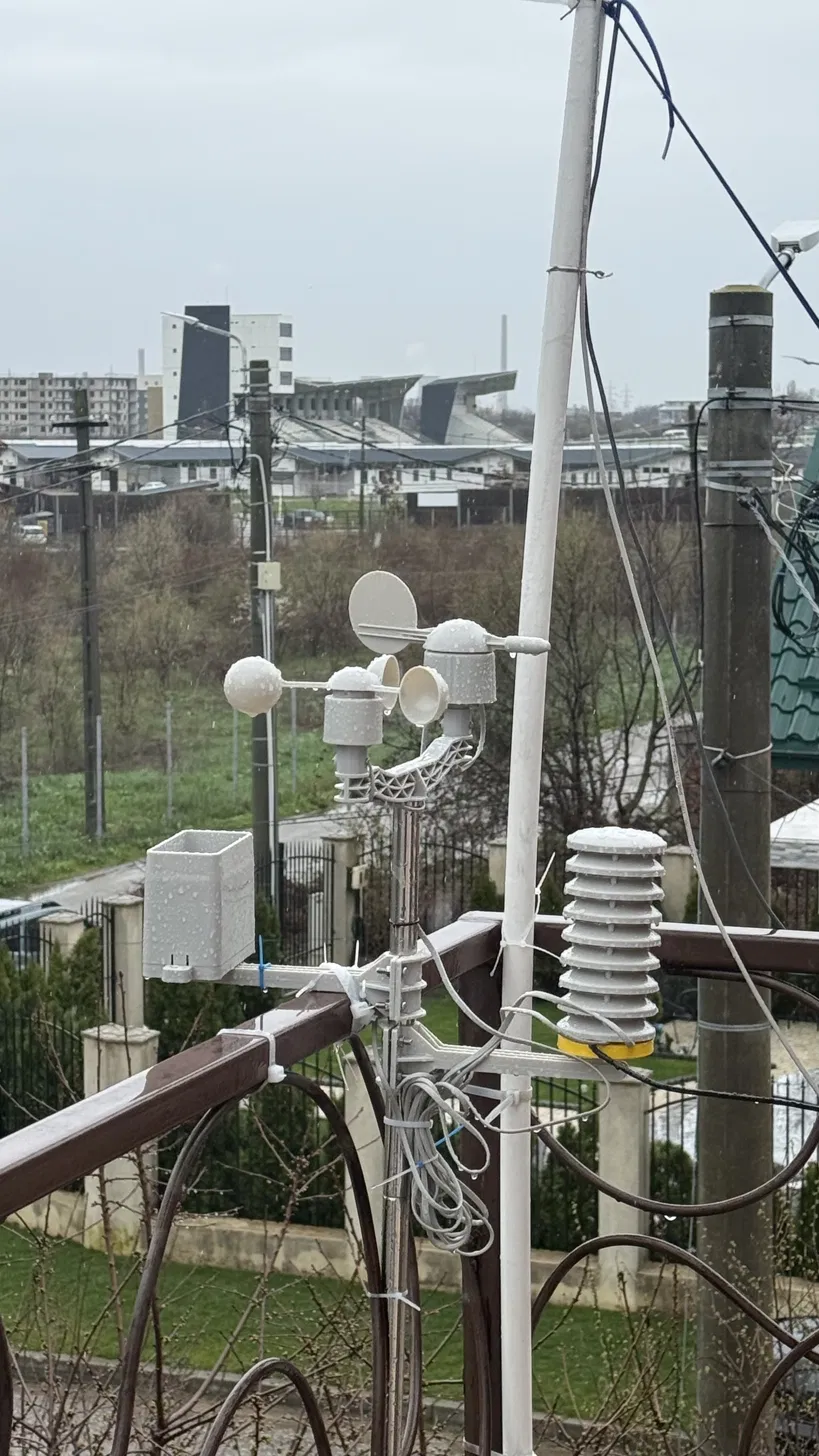
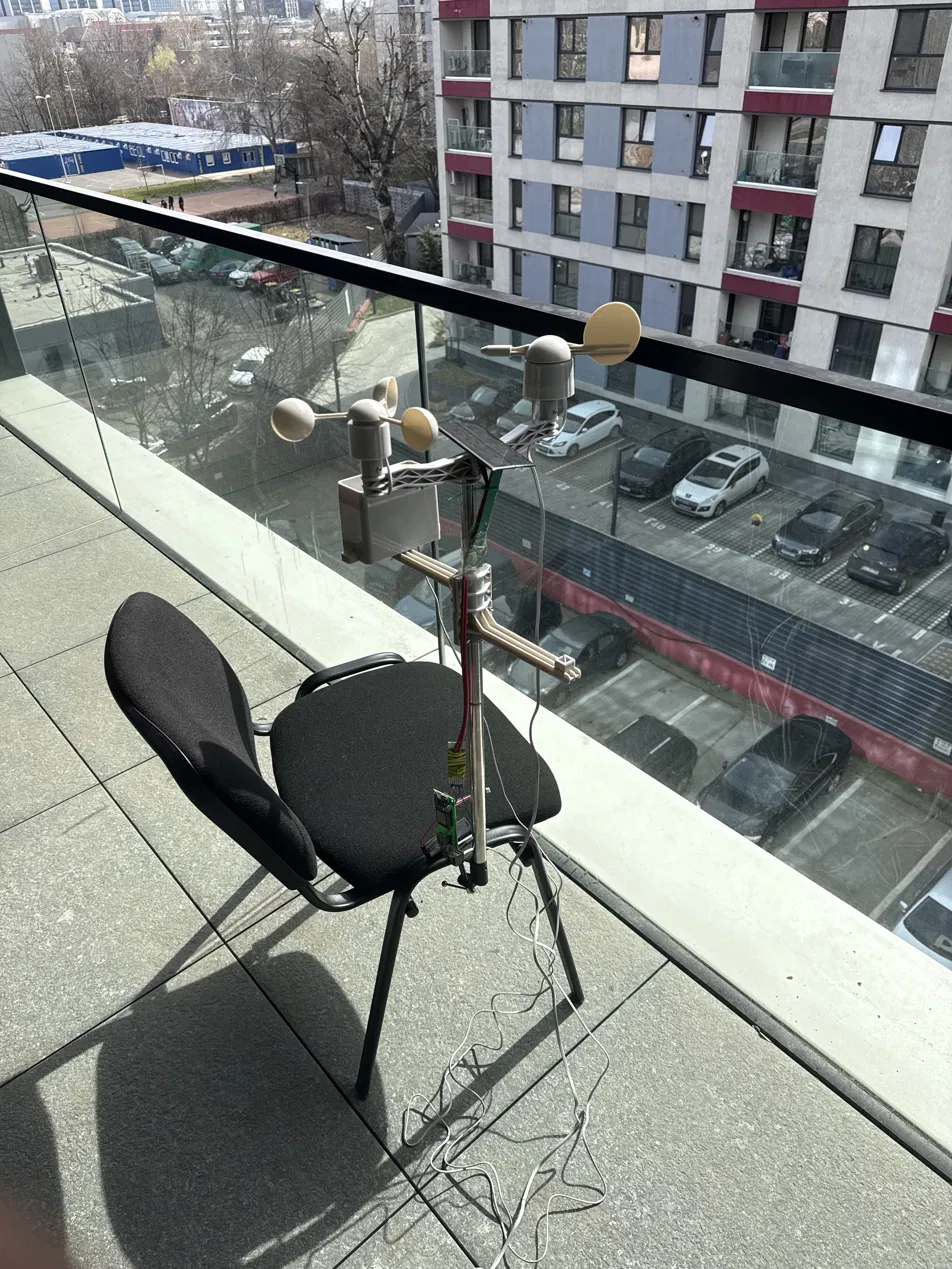
| Lab assembly | First outdoor test | Field deployment |
|---|---|---|
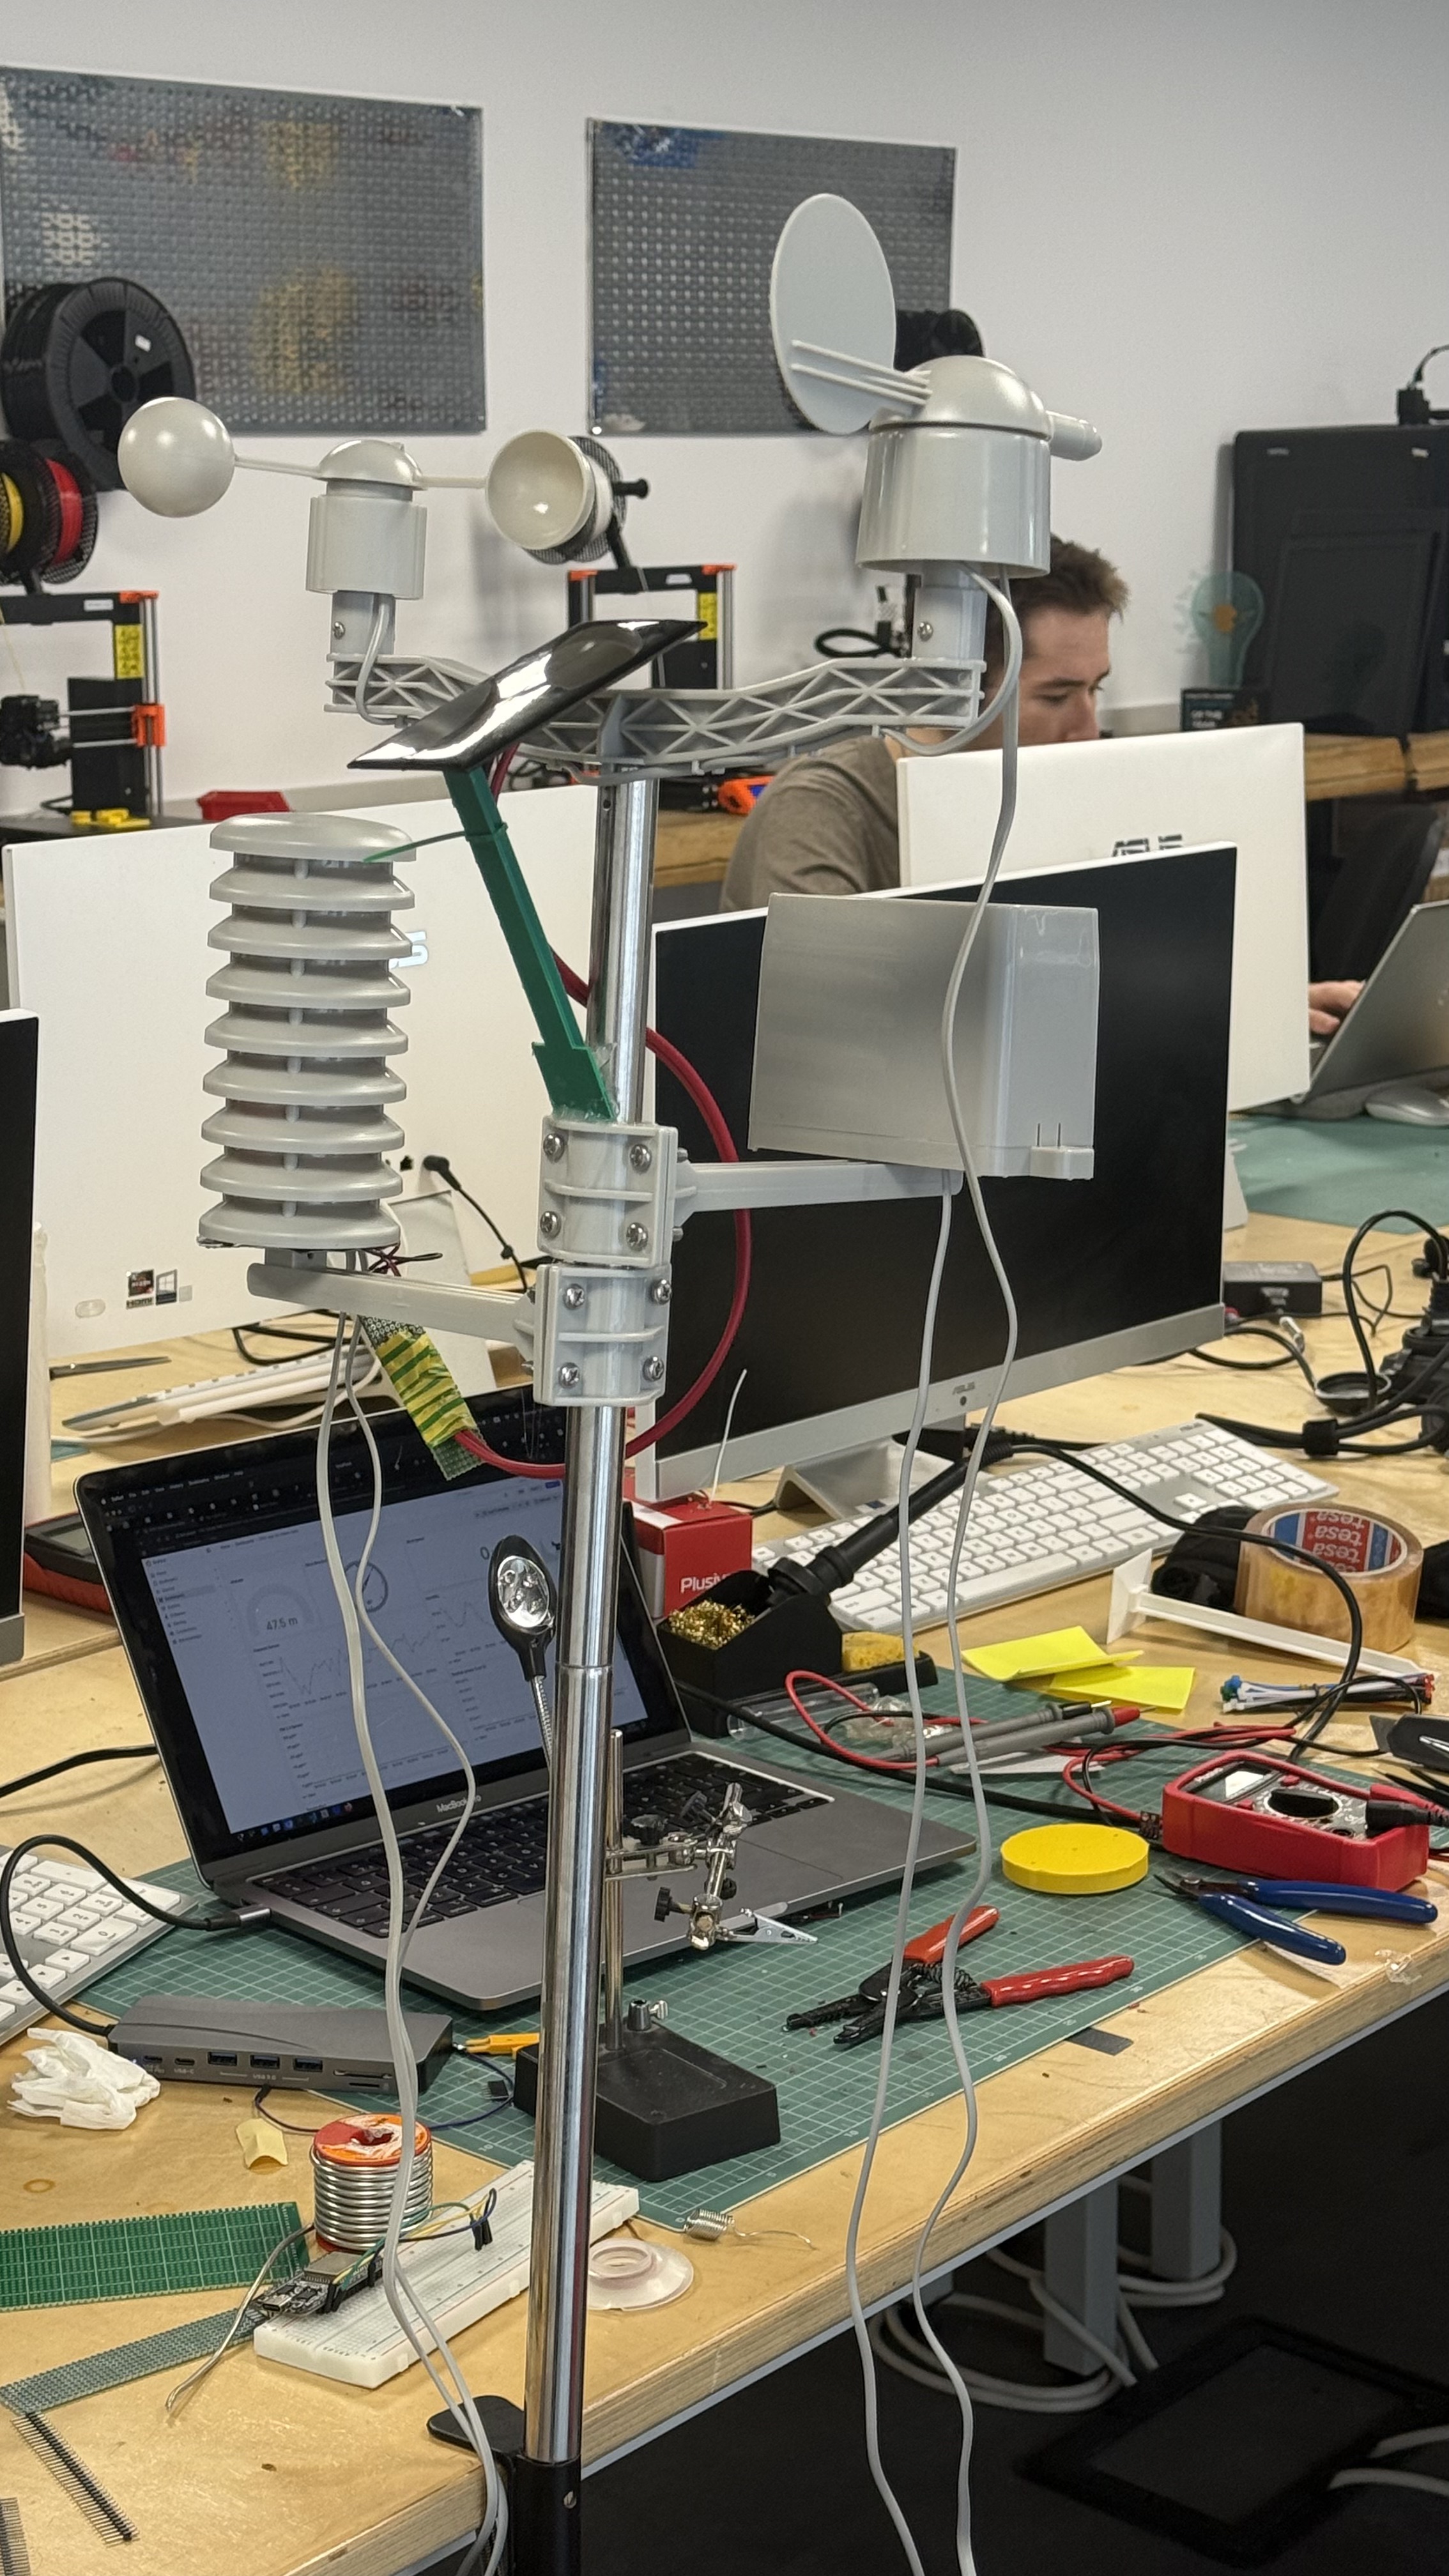 | 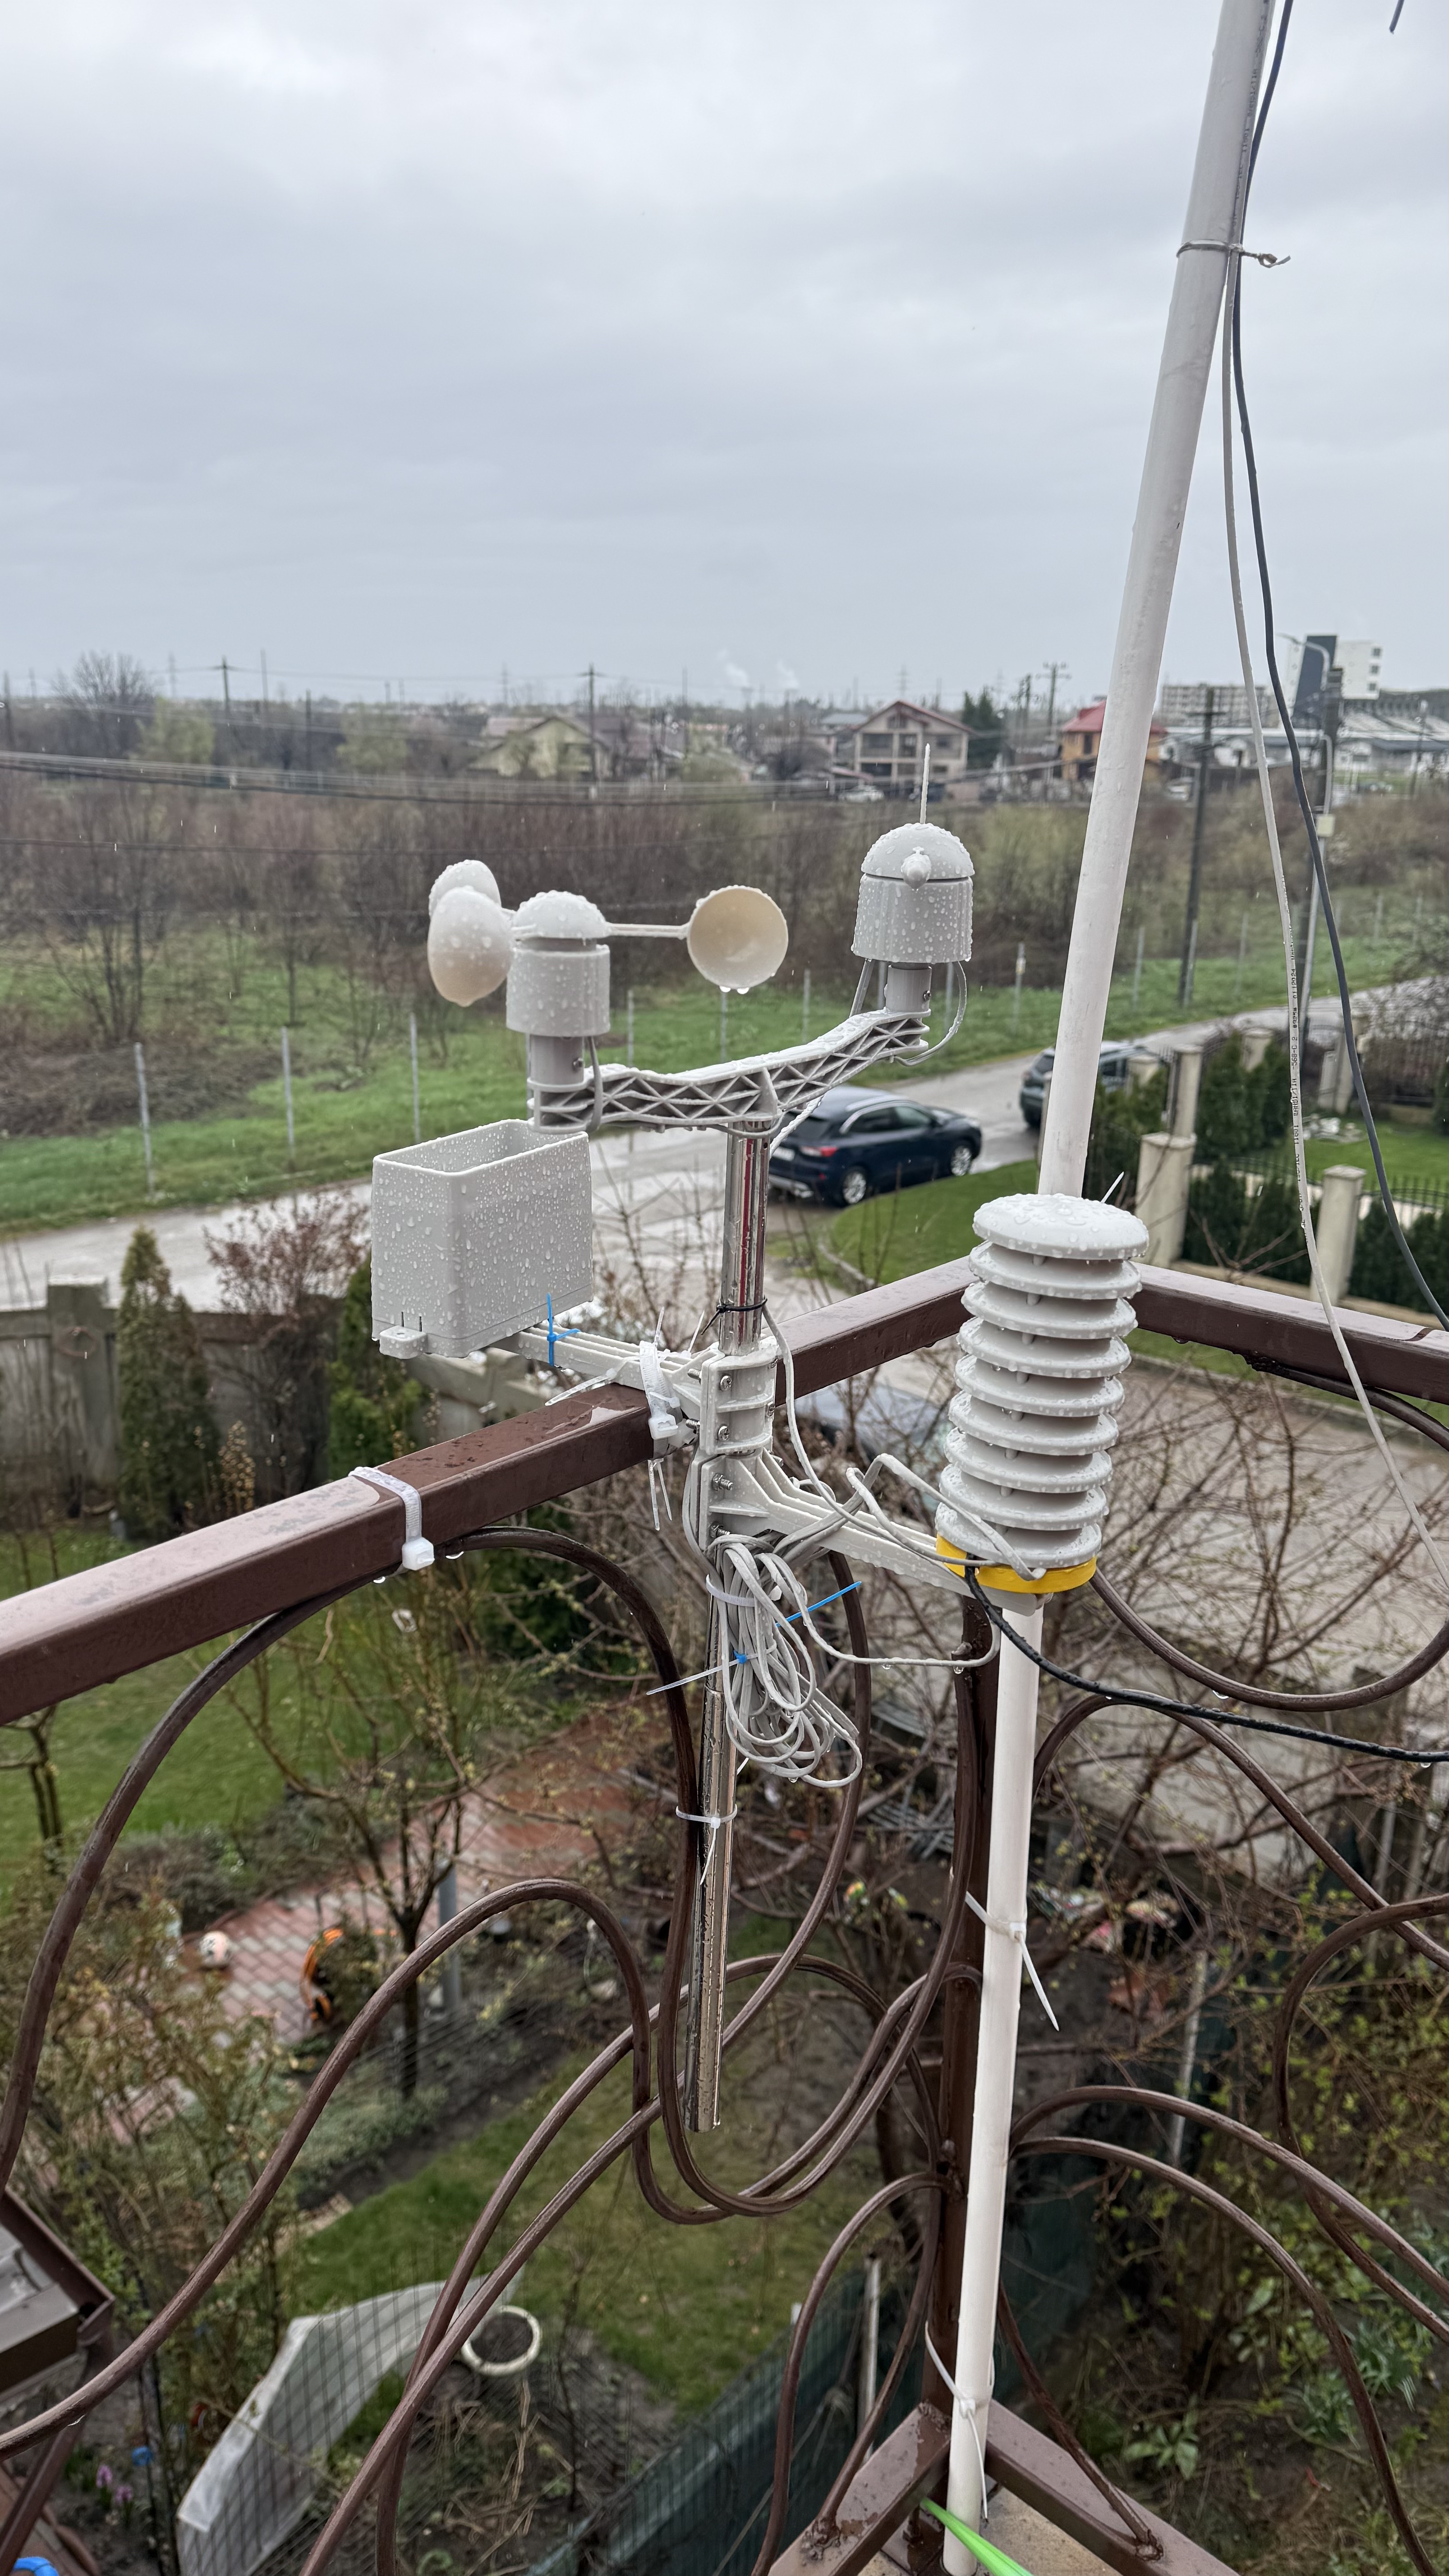 | 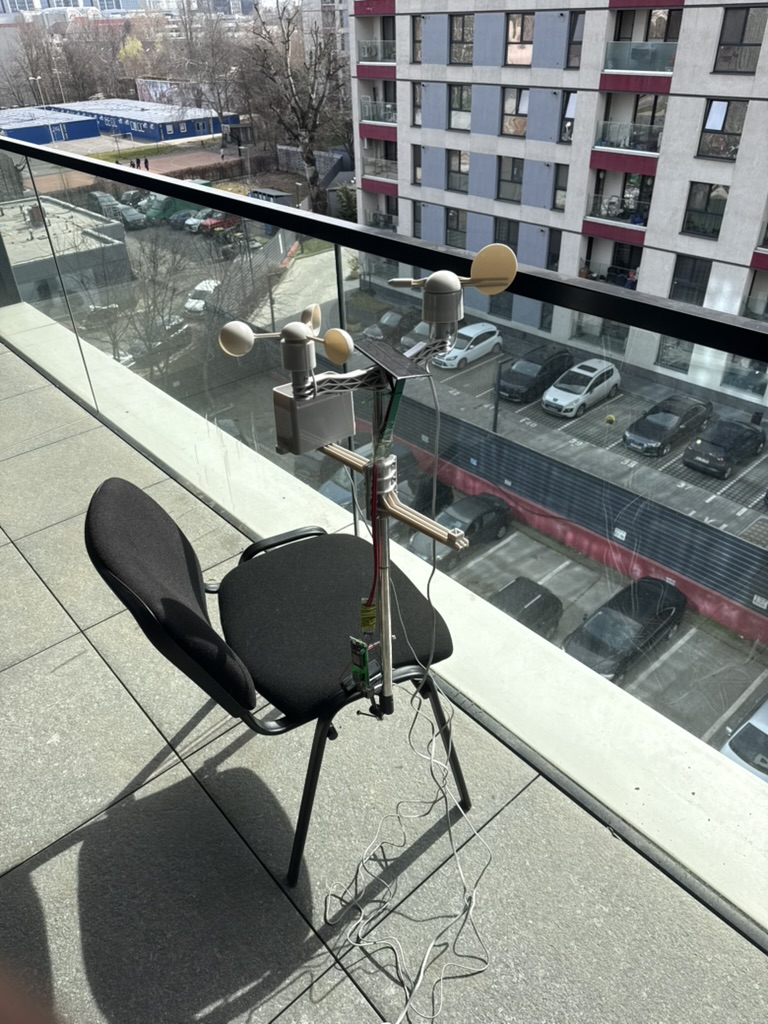 |
| SparkFun weather meter mounted on test stand, breadboard wiring visible, first firmware tests in the lab | Early outdoor validation on a university balcony — breadboard ESP32 still exposed, weather meter fully assembled | Final deployment: custom PCB v2 in enclosure, Stevenson screen housing the BME280, full sensor suite on the balcony rail since 14 April 2026 |
| Front (3D render) | Back (3D render) | Schematic |
|---|---|---|
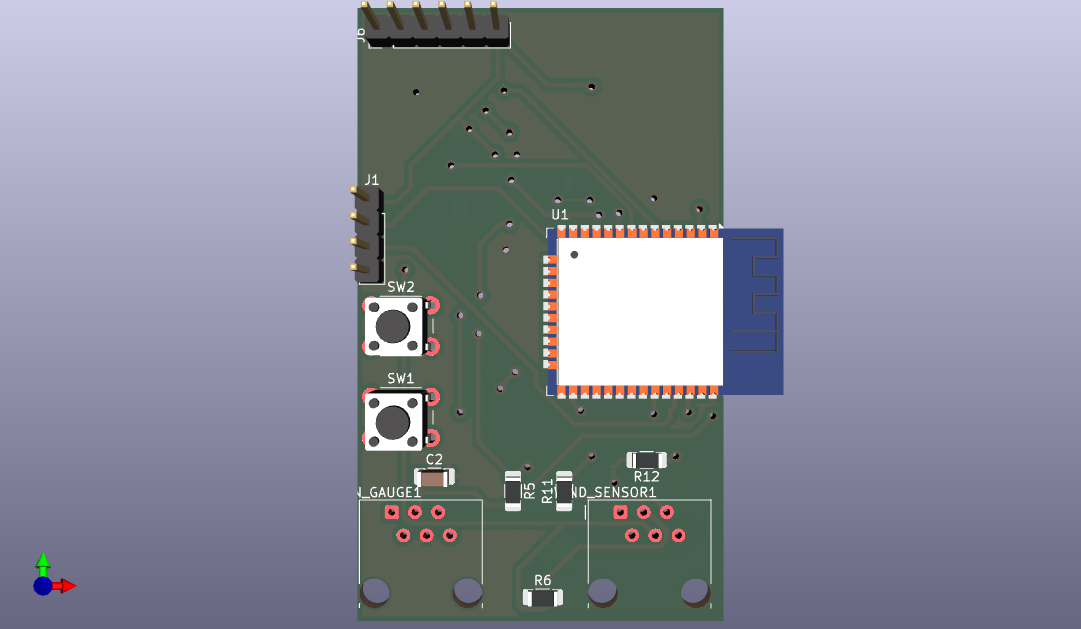 | 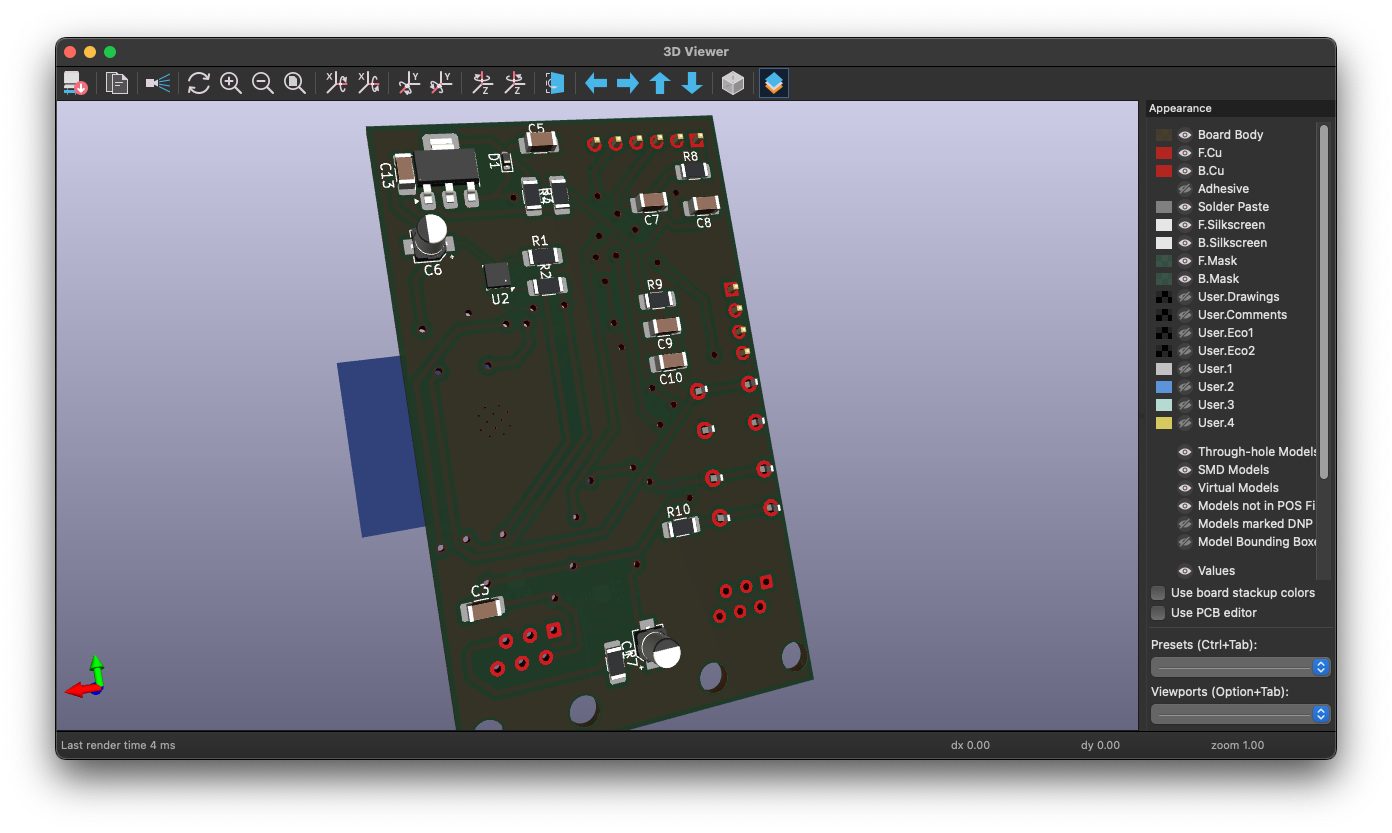 | 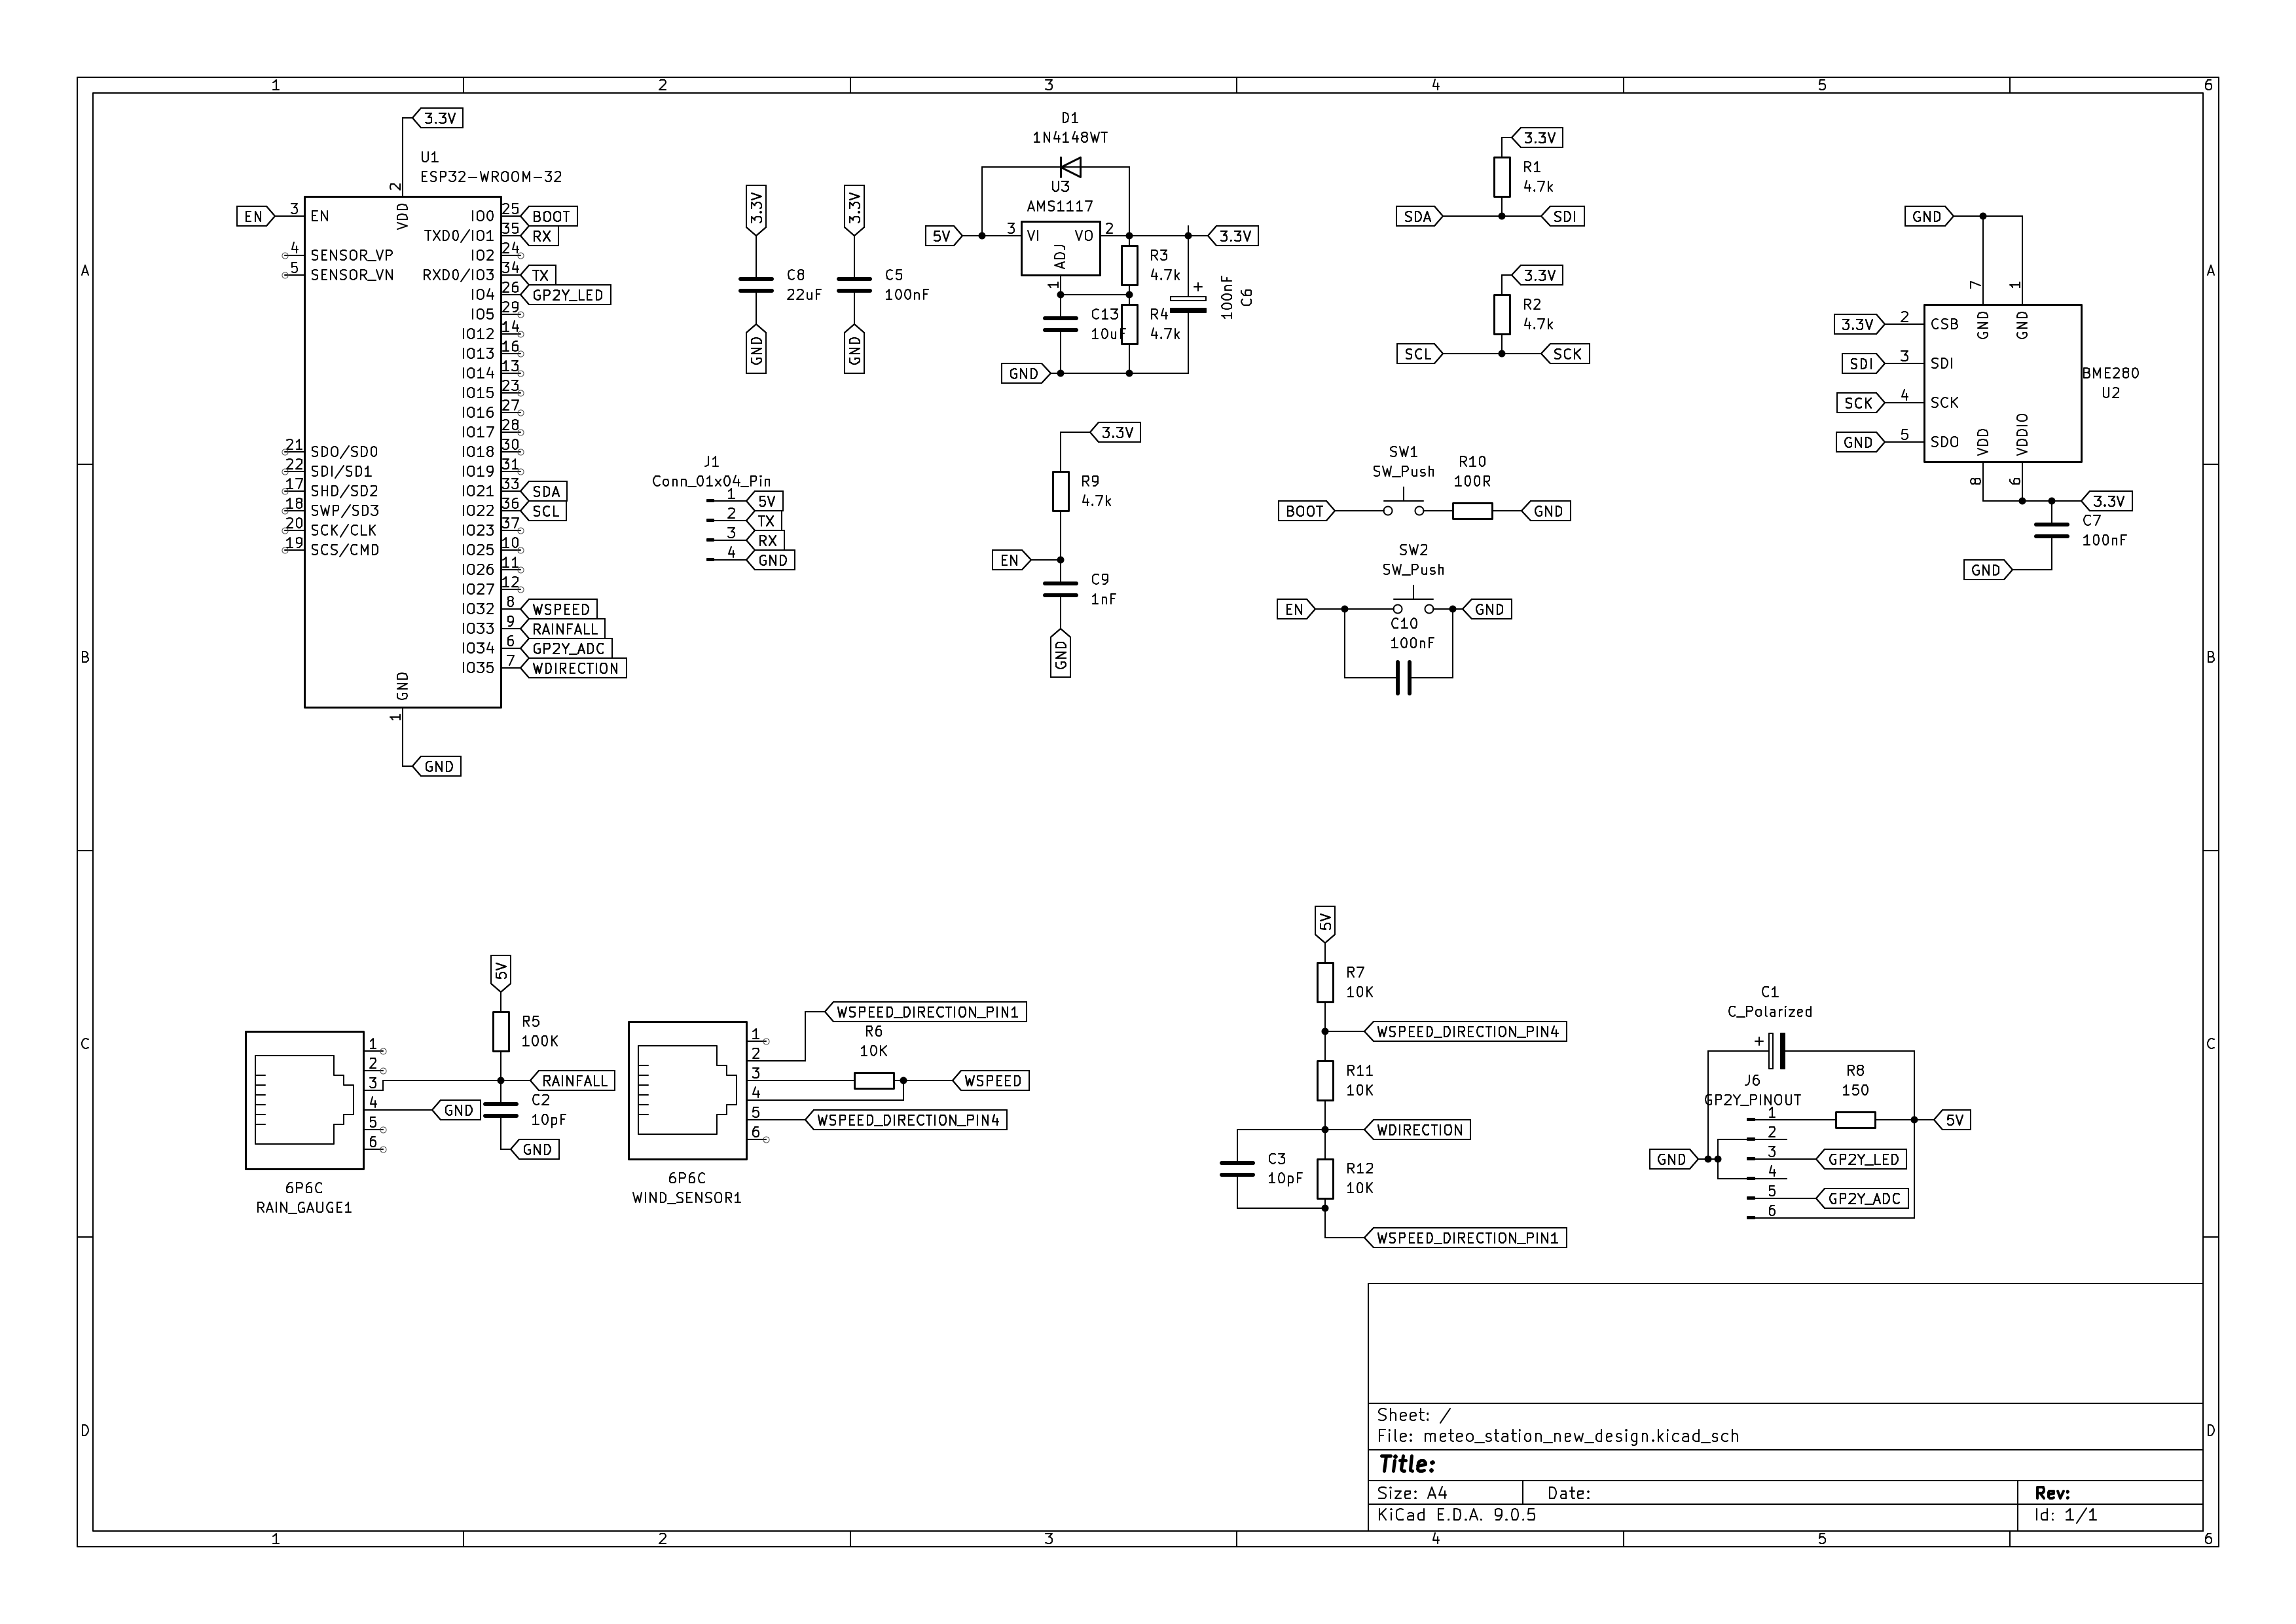 |
| Custom two-layer KiCad PCB v2 | Back copper layer, ground plane | Full circuit schematic |
All hardware photos: Ploiești, Romania, 2026.
iGround measures temperature, humidity, barometric pressure, wind speed, wind direction, rainfall, and PM2.5 particulate matter in real time. Every 5 minutes the ESP32 edge node sends a JWT-authenticated HTTPS POST to a Flask backend running on the Jetson Orin Nano. Every 5 hours, a forecasting container retrains a multi-head LSTM and a Ridge regression model from scratch on all accumulated data and writes 5-hour ahead predictions back to Redis TimeSeries. A Grafana dashboard and a Flutter mobile app consume the data and forecasts in real time.
 Key numbers at a glance:
| Metric | Value |
|---|---|
| Uptime since deployment | 30+ days continuous (since 14 Apr 2026) |
| Forecast cycles completed | ~144 autonomous (no manual intervention) |
| Temperature forecast MAE | 0.29 °C (within BME280 ±0.5 °C spec) |
| Humidity forecast MAE | 0.92 %RH (within BME280 ±3 %RH spec) |
| Pressure forecast MAE | 0.018 hPa (Ridge regression) |
| Sensor polling interval | 5 minutes |
| Forecast retraining interval | 5 hours |
┌──────────────────────────────────────────────────────────────────┐
│  Edge Node                                                       │
│  ESP32-WROOM-32 · Custom PCB v2                                  │
│  BME280 · GP2Y · SparkFun Weather Meter                          │
│  FreeRTOS · ESP-IDF · mbedTLS HMAC-SHA256 JWT                    │
└────────────────────────┬─────────────────────────────────────────┘
                         │ HTTPS POST /sensor  (JWT, every 5 min)
                         ▼
┌──────────────────────────────────────────────────────────────────┐
│  Gateway — NVIDIA Jetson Orin Nano (JetPack 6.x)                 │
│                                                                  │
│  ┌─────────────┐  ┌──────────┐  ┌────────┐  ┌────────────────┐   │
│  │ Flask + AAA │  │  MySQL   │  │ Redis  │  │  Forecasting   │   │
│  │ Gunicorn    │─►│ audit log│  │ Time   │  │  Container     │   │
│  │ Nginx/TLS   │  └──────────┘  │ Series │◄─│  LSTM + Ridge  │   │
│  └─────────────┘                └───┬────┘  │  (every 5h)    │   │
│                                     │       └────────────────┘   │
│  (all services managed by Docker Compose)                        │
└─────────────────────────────────────┬────────────────────────────┘
                                      │
                    ┌─────────────────┴──────────────────┐
                    │                                    │
                    ▼                                    ▼
┌──────────────────┐ ┌─────────────────────┐/sensor.sensor:{chip_id}:{metric} and compacted hourly to sensor:{chip_id}:{metric}:hourly.forecast:{metric} keys, and exits./api/ds/query).
Designed in KiCad, manufactured as a two-layer board. The second revision corrected all first-iteration footprint errors and added IP65-compatible enclosure mounting points.
Bill of Materials (key components):
| Component | Part | Notes |
|---|---|---|
| Microcontroller | ESP32-WROOM-32 | Dual-core, Wi-Fi, hardware AES/SHA |
| T/H/P sensor | Bosch BME280 | I²C 0x76, replaces SHT21 + MS5611 |
| Dust sensor | Sharp GP2Y1010AU0F | Optical, 320 µs LED pulse |
| Weather meter | SparkFun SEN-15901 | Anemometer, vane, rain gauge |
| LDO regulator | AMS1117-3.3 | 5 V → 3.3 V, ~96 mA typical |
| Protection diode | 1N4148 | Reverse-polarity protection |
Power budget: ~96 mA typical, ~271 mA peak (during TLS handshake).
The station went through three physical iterations before the final deployment:
| Phase | Description |
|---|---|
| Breadboard | Initial sensor wiring, Arduino framework, SHT21 + MS5611 |
| Perfboard | First semi-permanent layout, sensor replacement with BME280 |
| Custom PCB v2 | KiCad two-layer board, fixed footprints, enclosure mounting |
Written in C using the native ESP-IDF toolchain (migrated from Arduino for SMP FreeRTOS and hardware crypto access).
| Task | Stack | Description |
|---|---|---|
rest_worker_task | 16 384 B | JWT generation (mbedTLS HMAC-SHA256) + HTTPS POST |
bme280_task | 4 096 B | I²C forced-mode read, compensation math |
wind_speed_task | 2 048 B | ISR-driven anemometer pulse counter |
wind_vane_task | 2 048 B | ADC + 16-direction lookup table |
rain_task | 2 048 B | ISR-driven tipping bucket counter (0.2794 mm/tip) |
gp2y_task | 2 048 B | 320 µs LED pulse, ADC sample at 280 µs |
Note on stack size:
rest_worker_taskuses 16 KB because mbedTLS TLS handshake, HMAC-SHA256, and JSON serialisation all run in the same task context. The value was determined withuxTaskGetStackHighWaterMark().
esp_adc_cal_characterize() + esp_adc_cal_raw_to_voltage(). Error reduced from ±150 mV to ±30 mV.i2c_set_timeout() set to 40 ms to avoid false ESP_ERR_TIMEOUT during the 2 ms measurement window.All services run on the Jetson Orin Nano via Docker Compose.
| Service | Image | Role |
|---|---|---|
flask | custom | REST API, JWT verification, AAA |
gunicorn | custom | WSGI server for Flask |
nginx | nginx:alpine | TLS termination, reverse proxy |
mysql | mysql:8 | Audit log, user/device registry |
redis | redis/redis-stack | TimeSeries data store |
grafana | grafana/grafana | Dashboard + API middleware |
forecast | custom (TF2/CUDA) | Runs every 5 h, then exits |
sensor:{chip_id}:{metric}           # raw 5-min readings
sensor:{chip_id}:{metric}:hourly    # auto-compacted hourly aggregates
forecast:{metric} # 10-step 5-h ahead predictionsEvery incoming request goes through Authentication (JWT signature check), Authorisation (chip-ID whitelist match), and Accounting (MySQL audit log entry). Unauthenticated or unknown devices are rejected at the Flask layer before any data reaches Redis.
The forecasting container runs on the Jetson's 1024-core Ampere GPU (CUDA 12.6, driver 540.4.0, JetPack 6.x). Because the Jetson uses unified LPDDR5 memory, tensors built from Redis data are immediately accessible to the GPU with no explicit copy.
| Variable | Model | Rationale |
|---|---|---|
| Temperature | Multi-head LSTM (shared trunk) | Strong diurnal pattern, T-H coupling |
| Humidity | Multi-head LSTM (shared trunk) | Clausius-Clapeyron coupling with T |
| Pressure | Ridge regression | R²=0.238 vs temperature — largely independent, autocorrelation dominates |
| Rain probability | Sigmoid of ΔP tendency | Falling pressure → precipitation risk |
The T-H coupling is the key architectural insight: temperature and humidity share an LSTM trunk with separate output heads, allowing the model to exploit the inverse Clausius-Clapeyron relationship directly.
| Model | MAE | RMSE |
|---|---|---|
| Temperature (LSTM) | 0.2906 °C | 0.4256 °C |
| Humidity (LSTM) | 0.9198 %RH | 1.2605 %RH |
| Pressure (Ridge) | 0.0178 hPa | 0.0245 hPa |
Both LSTM results are within the BME280's own sensor accuracy specification.
[scheduler triggers every 5h]
  → forecasting container starts
  → reads all data from Redis TimeSeries
  → retrains LSTM + Ridge from scratch on full dataset
  → writes 10-row forecast to forecast:* keys
  → container exits
Each retraining run takes approximately 7–10 minutes on the Jetson GPU.
Serves as both a monitoring dashboard and a data API middleware for the Flutter app.
The Flutter app never connects to Redis directly — all data goes through Grafana's
/api/ds/query endpoint using Basic Auth.
Dashboard rows:
Cross-platform (Android + iOS), connects to Grafana's REST API over HTTPS.
Key endpoints used:
| Endpoint | Purpose |
|---|---|
GET /api/user | Authentication (Basic Auth) |
GET /api/user/orgs | Role detection (viewer/editor/admin) |
POST /api/ds/query | Sensor data + forecasts from Redis |
GET /api/admin/users | User management (admin only) |
Architecture: three-layer — GrafanaService singleton →
StatefulWidget with Timer.periodic(5s) + Future.wait → stateless UI widgets.
| Metric | Value |
|---|---|
| Deployment start | 14 April 2026 |
| Continuous uptime | 30+ days |
| Forecast cycles | ~144 (no manual restarts) |
| Dataset size (May 2026) | ~7 580 hourly rows and growing |
| Retraining time | 7–10 min/cycle on Jetson GPU |
| Redis write latency | < 1 s (pipeline batch) |
The pressure model MAE varied slightly across deployment (0.0145–0.0187 hPa), with a temporary increase during a frontal passage on 12–13 May. The model recovered as new data from that weather regime was accumulated — expected behaviour for a continuously retrained model.
| Qty | Value | Footprint | References |
|---|---|---|---|
| 4 | 10K | Resistor_SMD:R_1206_3216Metric_Pad1.30x1.75mm_HandSolder | R2, R3, R5, R6 |
| 2 | 10pF | Capacitor_SMD:C_1206_3216Metric_Pad1.33x1.80mm_HandSolder | C1, C2 |
| 1 | 100K | Resistor_SMD:R_1206_3216Metric_Pad1.30x1.75mm_HandSolder | R1 |
| 1 | 150 | Resistor_SMD:R_1206_3216Metric_Pad1.30x1.75mm_HandSolder | R4 |
| 1 | C_Polarized | Capacitor_SMD:CP_Elec_3x5.3 | C3 |
| 1 | ESP32_NODEMCU | ESP32_NODEMCU:MODULE_ESP32_NODEMCU | U1 |
| 1 | GP2Y_PINOUT | Connector_PinHeader_2.54mm:PinHeader_1x06_P2.54mm_Vertical | J6 |
| 1 | MS5611_PINOUT | Connector_PinHeader_2.54mm:PinHeader_1x07_P2.54mm_Vertical | J4 |
| 1 | RAINFALL_SENSOR | Connector_PinHeader_2.54mm:PinHeader_1x06_P2.54mm_Vertical | J1 |
| 1 | SHT21_PINOUT | Connector_PinHeader_2.54mm:PinHeader_1x04_P2.54mm_Vertical | J3 |
| 1 | WIND_SENSOR | Connector_PinHeader_2.54mm:PinHeader_1x06_P2.54mm_Vertical | J2 |
google/mozc-devices
Circuit diagrams and firmware source code for Gboard DIY keyboards

hoglet67/RGBtoHDMI
Bare-metal Raspberry Pi project that provides pixel-perfect sampling of Retro Computer RGB/YUV video and conversion to HDMI

mntmn/amiga2000-gfxcard
MNT VA2000, an Open Source Amiga 2/3/4000 Graphics Card (Zorro II/III), written in Verilog

hackclub/OnBoard
💡 Join 1,000 teenagers and make your first PCB with a $100 grant!

kenp-io/not-for-airpods-repairs
The content of this repository is licensed under the WTFPL License. Please have a close look at the terms before using this material.

Luos-io/luos_engine
Open-source and real-time orchestrator for cyber-physical-systems, to easily design, test and deploy embedded applications and digital twins.

Chrismettal/EleLab_v2
Cheap DIY lab system for hobbyists and the tinkering folk

It measures 38.8 × 67 mm and has 2 copper layers, 1.6 mm thick.
15 parts. The full list of its parts is on this page, with links to each part's symbol and footprint where PCBKit's library has them.
From the ionutz04/REST-API_Meteo_Station repository on GitHub, at the commit this page was made from: the board is meteo_station/meteo_station.kicad_pcb and its schematic meteo_station/meteo_station.kicad_sch. PCBKit opens the board in the browser, with nothing to install.
Its repository states no licence, so its author keeps all rights: ask ionutz04 before reusing the design.