2 layers
 glingy/playground1
This repository contains the development kit for building code for the Atmel SAM D21 playground board. This board was developed to help members of the Solar Car Club (Prisum) at Iowa State University to learn how to…
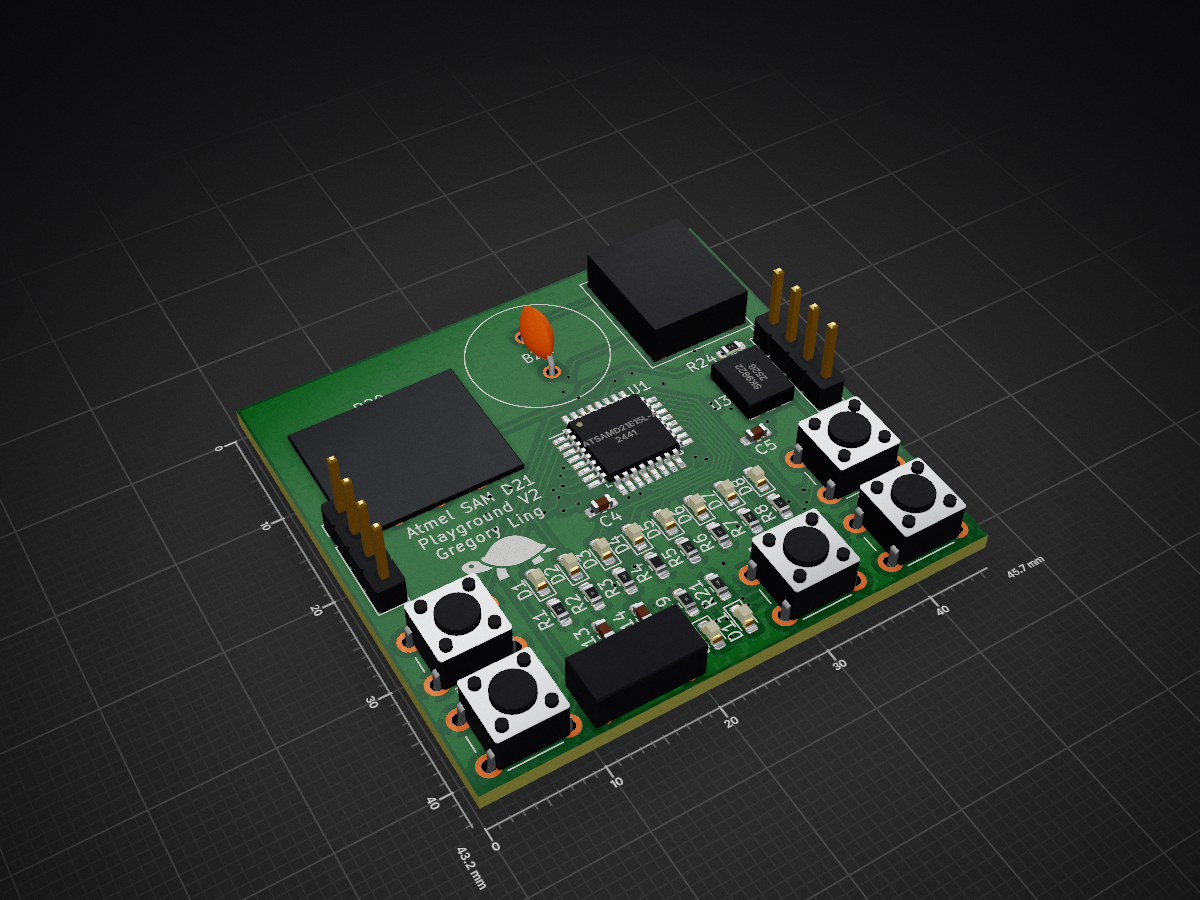
D21Debug is an open-source printed circuit board by glingy, from the glingy/playground repository on GitHub. It is a 2-layer board of 45.7 × 43.2 mm with 63 parts on 70 nets, routed with 453 tracks and 71 vias.
It is built around the ATSAMD21E15L-AF, ATSAMD21E16B-UU and SK9822, with the MIC5365-3.3YC5-TR, INND-TS40RAB and P120PK-Y25BR10K among its other parts. Its parts include 24 resistors, 12 capacitors, 11 diodes, 4 ICs and 3 connectors. It belongs with the SAM D and SAM boards of this library.


This repository contains the development kit for building code for the Atmel SAM D21 playground board. This board was developed to help members of the Solar Car Club (Prisum) at Iowa State University to learn how to program very low level embedded code. This repository is a reduced version of the development environment used by the team.
build-essential package on Ubuntu, Run xcode-select --install in a terminal on macOS, or install from https://git-scm.com/downloads for Windows)Open Folder...)Hidden Items tab in the explorer sidebar to see them. If it's hidden, you can ignore it for the most part..vscode - VSCode configuration. Suggested extensions, file type associations, configuration of what's hidden, etc.boards - PlatformIO board definition for the playground board.include - Shared header files across all projects (See PlatformIO documentation)lib - Shared library code across all projects (See PlatformIO documentation)scripts - Linker scripts and C startup files. You probably won't need to touch this, but feel free to exploresources - The code folder! To create a new project, create a new folder in here. To be detected as a valid project, it must contain at least once .c file..clang-format - Auto-formatter config file. It's who you blame if your code magically reorganizes whenever you save the file..gitignore - Tells git to ignore specific files which should not be tracked..multisrc - Tells the multisrc extension to activate and allow you to select source folders.README.md - This file!platformio.ini - PlatformIO config file.multisrc.ini - Generated PlatformIO config file by multisrcPlatformIO adds a lot of buttons to the bottom status bar in VSCode. From left to right:
pio command set up for debugging the development environment.local.ini. See platform.ini for example debugger definitions.< something > indicates the source folder currently selected for running / debugging. It will be red if you're looking at a file not in the current project so you don't compile the wrong project on accident. Click that to select a different projectVariables are the global (and local) variables that were not optimized away. You can also hover over a variable to see its value. If it says <optimized away>, the compiler decided that variable wasn't worth keeping around, so you'll have to either declare it volatile and re-download (forces compiler to not optimize it out; remove volatile when done) or look around to find its value from nearby functions or calculations.Watch lets you type C expressions and see the results. This is extremely useful also for optimized math, you can put any simple C expression (including math) in there, &var or &var + len is often useful for checking addresses of different things.Call Stack shows which functions you're currently inside. If you go above main, you're now in the scripts/startup.c file. Click on an entry to jump to that function.Peripherals shows the current status of every register in the processor. Extremely useful, especially if something's just broken and you have no idea why. Sometimes, register values won't update unless you click on them to expand them, if you see it flash or a loading bar at the top flash by, it probably just updated. Most useful part of debugging.Breakpoints is self-explanatory. Click next to a line number to add a breakpoint. Note: Breakpoints listed there are for all projects, not just the current one, so it might be useful to remove breakpoints as soon as you're done with one.Registers is not very useful for us, it's the current value of every register in the processor.Memory enter a memory address and offset to see the hex value of that chunk of memory.Disassembly if it works, it will disassemble a function to let you see the assembly form it is currently running. I've had issues with that in the past.Help! LED doesn't turn on!
Help! A peripheral isn't working!
Help! I need to force wipe and reset the board!
Help! It's just not working!
| Qty | Value | Footprint | References |
|---|---|---|---|
| 19 | 1kΩ | Resistor_SMD:R_0603_1608Metric_Pad0.98x0.95mm_HandSolder | R1, R2, R3, R5, R6, R10, R11, R12, R13, R14, R15, R16, R19, R21, R23, R24 +3 |
| 9 | LED_SMD:LED_0603_1608Metric_Pad1.05x0.95mm_HandSolder | D1, D2, D3, D4, D5, D6, D7, D8, D11 | |
| 7 | 0.1uF | Capacitor_SMD:C_0603_1608Metric_Pad1.08x0.95mm_HandSolder | C1, C2, C3, C4, C9, C10, C11 |
| 5 | 10uF | Capacitor_SMD:C_0603_1608Metric_Pad1.08x0.95mm_HandSolder | C5, C6, C8, C13, C14 |
| 5 | SW_Push | Button_Switch_THT:SW_PUSH_6mm | locked, locked, SW3, SW4, SW5 |
| 2 | 10kΩ | Resistor_SMD:R_0603_1608Metric_Pad0.98x0.95mm_HandSolder | R18, R22 |
| 2 | Conn_01x04_Male | Connector_PinHeader_2.54mm:PinHeader_1x04_P2.54mm_Vertical | J2, J3 |
| 1 | 10uH | Inductor_SMD:L_0603_1608Metric_Pad1.05x0.95mm_HandSolder | L1 |
| 1 | 300Ω | Resistor_SMD:R_0603_1608Metric_Pad0.98x0.95mm_HandSolder | R17 |
| 1 | ATSAMD21E15L-A | Package_QFP:TQFP-32_7x7mm_P0.8mm | U1 |
| 1 | ATSAMD21E16B-U | CustomParts:WLCSP-35 | U4 |
| 1 | Buzzer | CustomParts:PS1240P02BT | BZ1 |
| 1 | INND-TS40RAB | CustomParts:INND-TS40RAB | D9 |
| 1 | LOGO | Turtle:Turtle0808 | G*** |
| 1 | LOGO | LOGO | G*** |
| 1 | MIC5365-3.3YC5 | Package_TO_SOT_SMD:SOT-353_SC-70-5 | U2 |
| 1 | Micro USB | CustomParts:MCR-B-S-RA-SMT-CS5A-NF-T | J1 |
| 1 | P120PK-Y25BR10K | CustomParts:P120PK-Y25BR10K | R20 |
| 1 | POWER | LED_SMD:LED_0603_1608Metric_Pad1.05x0.95mm_HandSolder | D10 |
| 1 | SK9822 | CustomParts:SK9822 | U3 |
| 1 | locked | Resistor_SMD:R_0603_1608Metric_Pad0.98x0.95mm_HandSolder | R4 |
It measures 45.7 × 43.2 mm and has 2 copper layers, 1.6 mm thick.
63 parts, built around the ATSAMD21E15L-AF, ATSAMD21E16B-UU, SK9822 and MIC5365-3.3YC5-TR. The full list of its parts is on this page, with links to each part's symbol and footprint where PCBKit's library has them.
From the glingy/playground repository on GitHub, at the commit this page was made from: the board is hardware/D21Debug.kicad_pcb and its schematic hardware/D21Debug.kicad_sch. PCBKit opens the board in the browser, with nothing to install.
Its repository states no licence, so its author keeps all rights: ask glingy before reusing the design.


LJWsao/sinitsa
KiCAD files for the all band receiver. This can pick up strong local sources of RF such as AM and FM radio stations.


Engineering-House/Project-Synthia
The programs used are as follows: - STMCube32MX - Visual Studio Code - STM32CubeIDE for Visual Studio Code (Extension Pack)


Lucasmnascimento94/Smart-Shower
This is an extended version of the project I made for my computer arquitecture class.