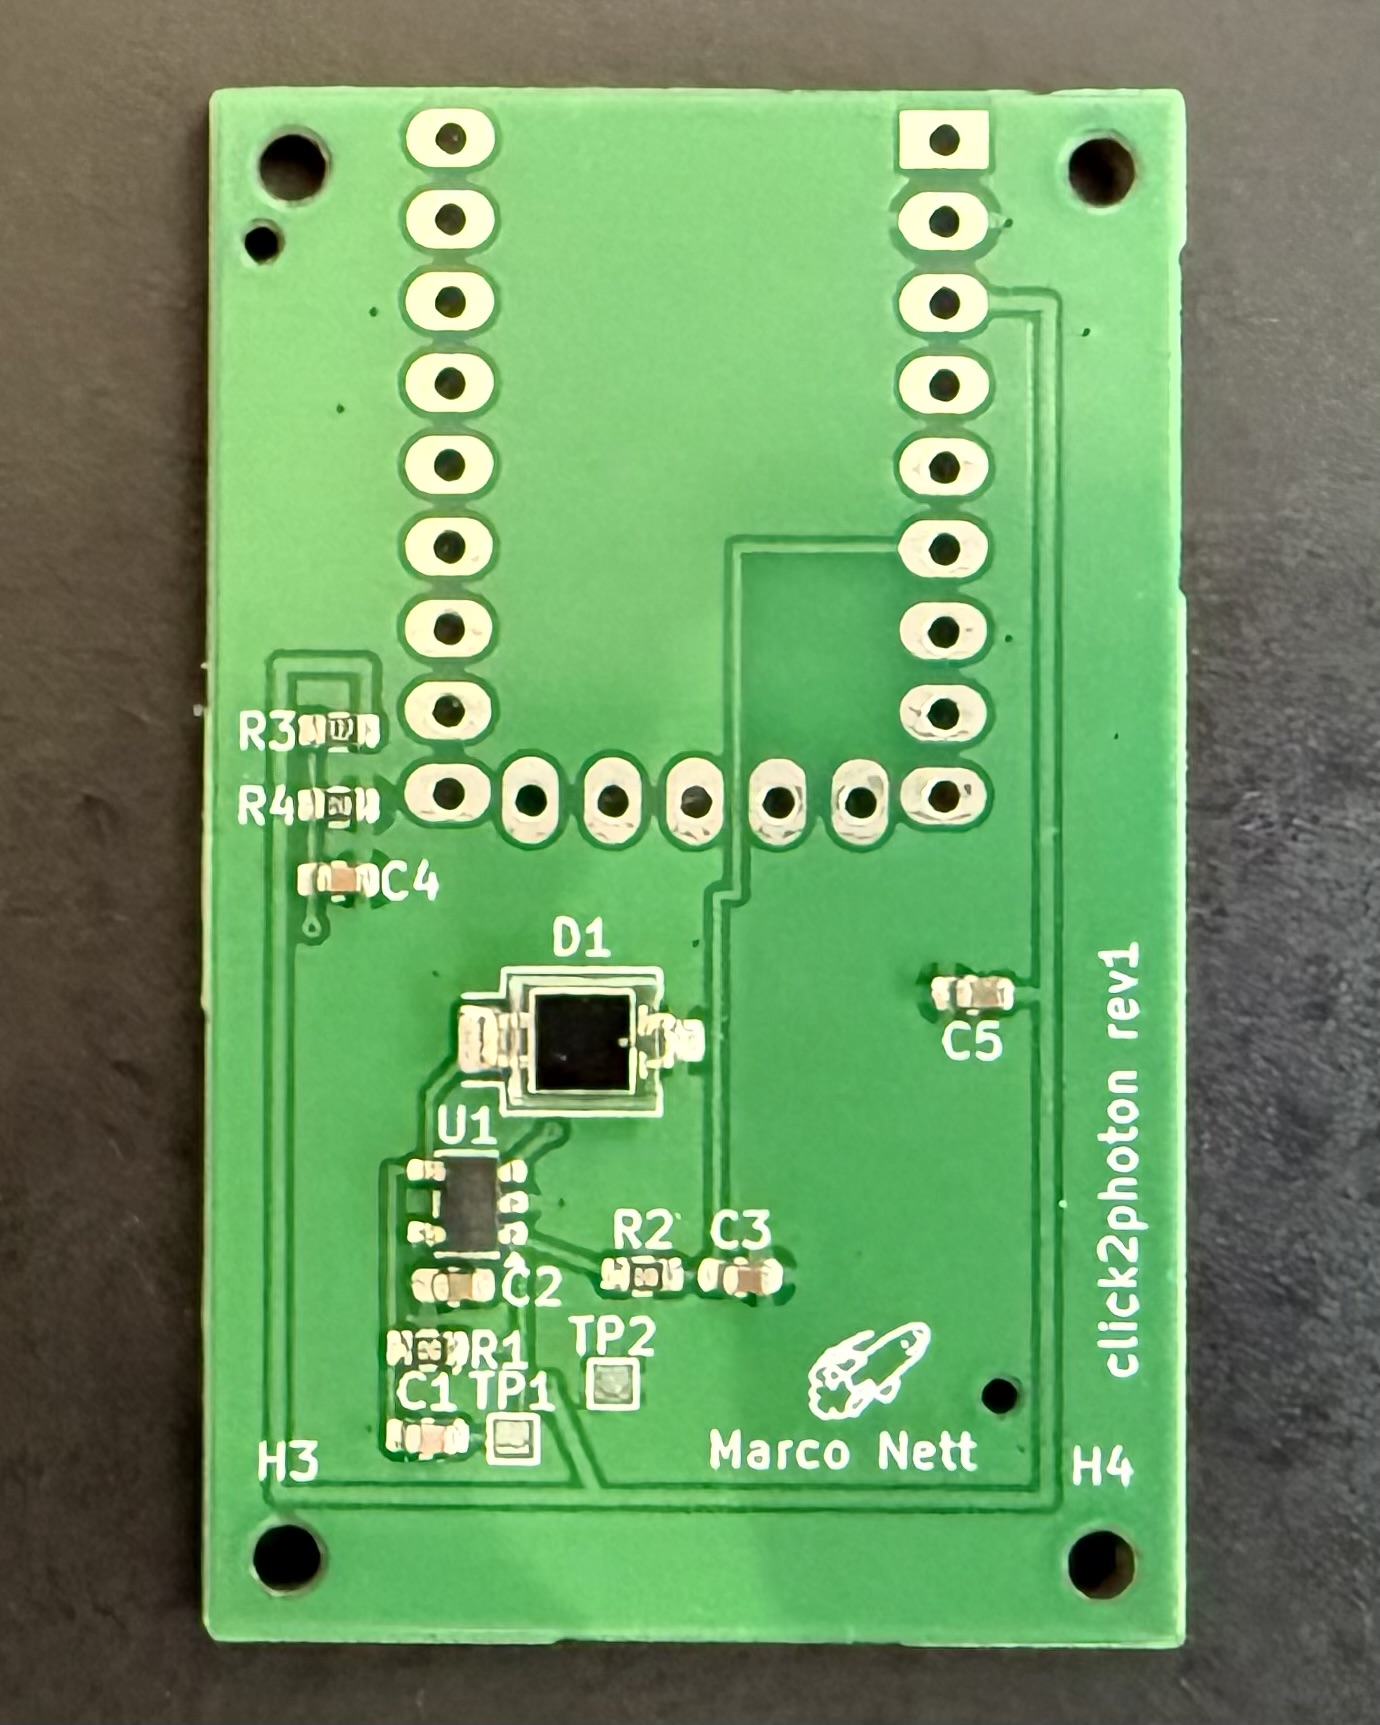
Frameprobe is an open-source printed circuit board by frameprobe, from the frameprobe/frameprobe repository on GitHub, published under the GPL-3.0 licence. It is a 2-layer board of 30 × 48 mm with 18 parts on 26 nets, routed with 37 tracks and 18 vias.
It is built around the TLV9061IDBVR-MS, RP2040-ZERO and VBPW34S. Its parts include 5 capacitors, 4 resistors, 2 ICs and 1 diode. It belongs with the sensors and measurement and lEDs and displays boards and the RP2040 boards of this library.
End-to-end display latency measurement: the time from a mouse input (click or
movement) to a visible change on screen, measured with a photodiode strapped to
the monitor.
How it works:
An RP2040 sends a USB HID mouse click (or, in move mode, a mouse movement)
The input causes a brightness change on the monitor under test (any application works, as long as the brightness difference is big enough)
The photodiode picks up the change
The RP2040 streams ADC samples over serial
The host logs them to CSV
analyze.py computes the latency
Components
Component
Path
Description
Hardware
hardware/
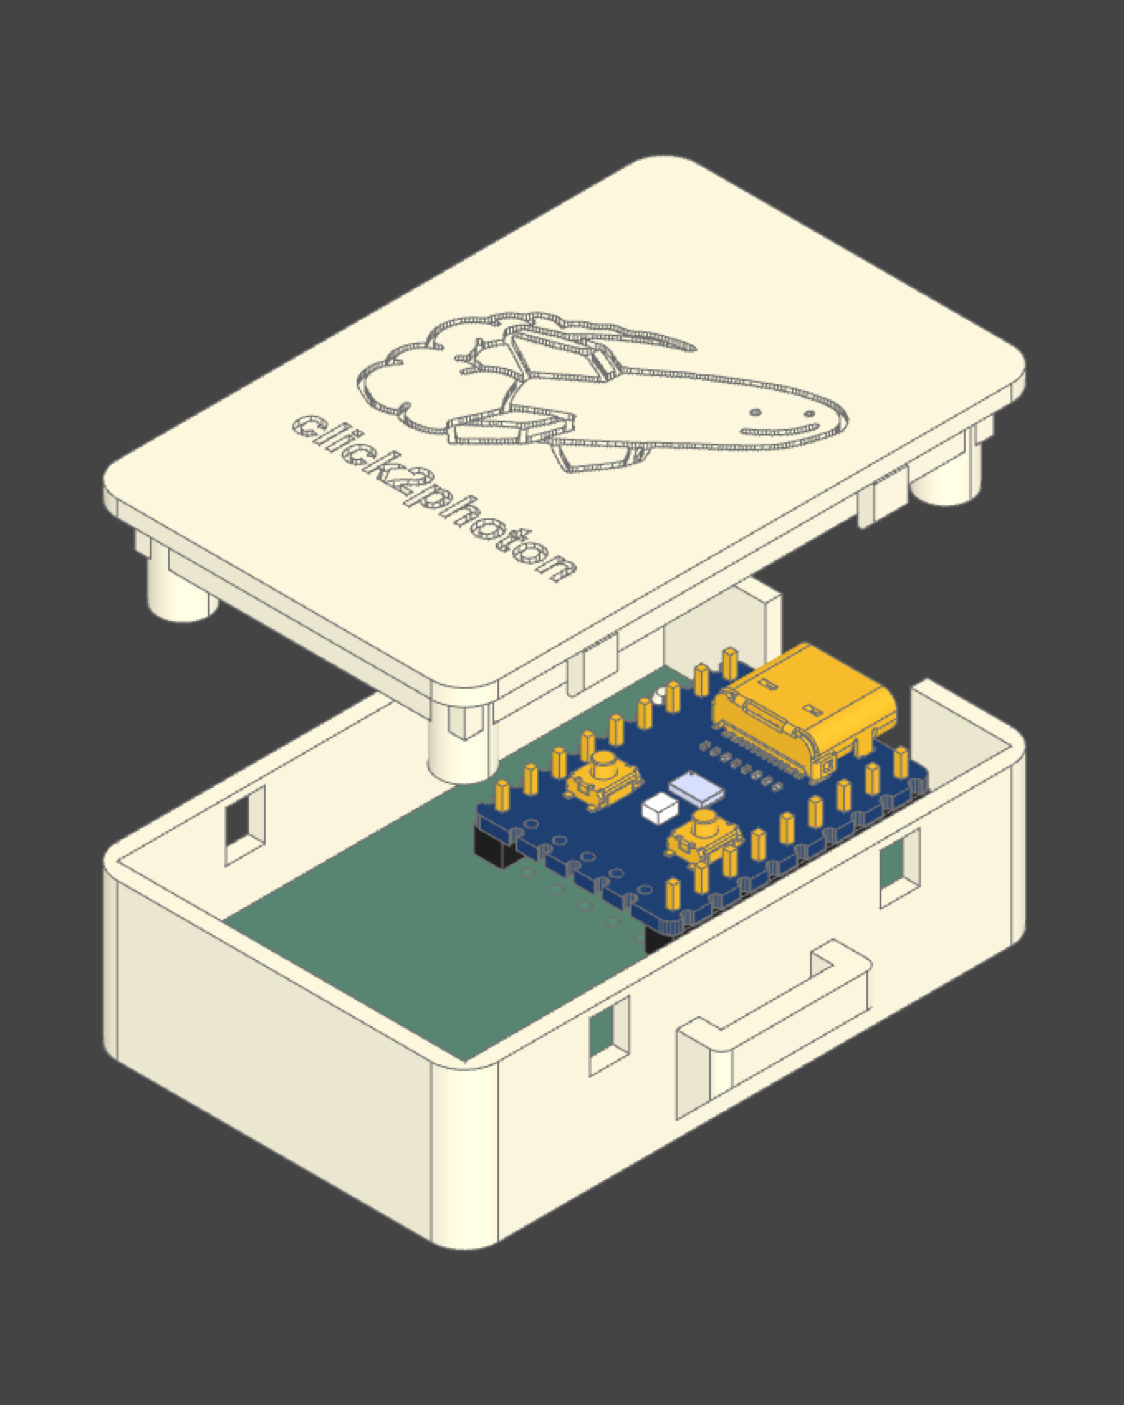
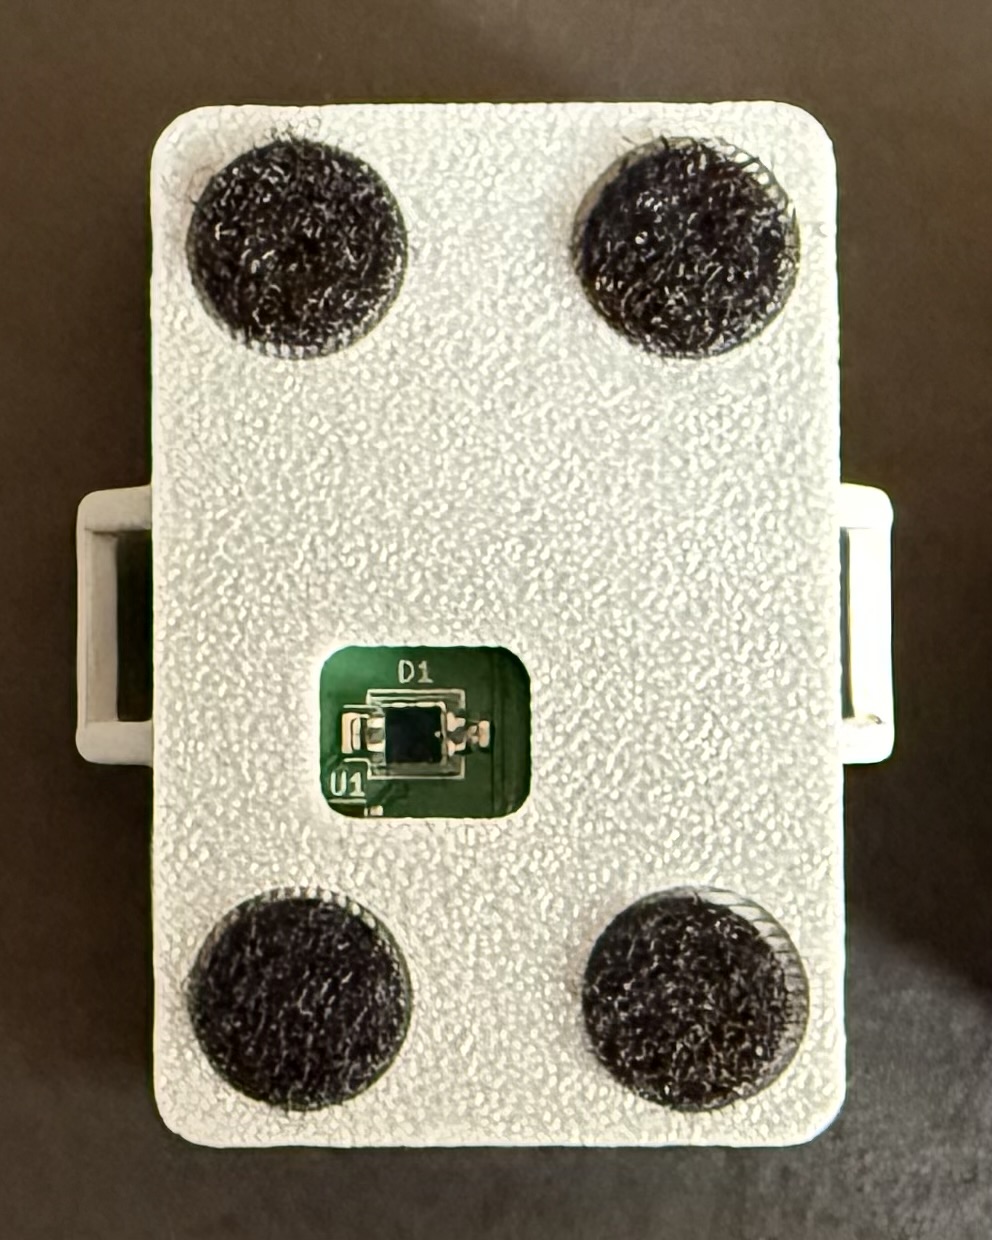
KiCad 10 PCB source (hardware/pcb/) and 3D-printable enclosure for the sensor (VBPW34S photodiode + TLV9061 transimpedance amplifier).
Firmware
arduino/
Runs on any RP2040 board. Fires the mouse input (click, or a single 16-bit HID move report in move mode), samples the photodiode on A1 (14-bit ADC, 12,000 samples per run), sends results as CSV lines over serial.
Host software
main.py
Interactive serial terminal. Starts/stops test runs, configures measurement mode, click count and interval, logs device data to output/*.csv.
Analyzer
analyze.py
Computes latency from session CSVs or whole folders. Reports signal/noise separation, mean ± 95% CI, sd, median, p5, p95, spread, min, max and an ASCII histogram. Every field is explained in analyze.md.
Chart data
analyze_all.py
Pools each direct subfolder of a results folder and prints chart-ready JSON (medians with error bars, plus shared-bin histograms) for comparing test cases.
Reference data
test_run1/
Captures and notes from an X11-vs-Wayland test matrix on a 500 Hz QD-OLED (test_setup.md, test_matrix.md). Done with Perfboard-era sensor, use -t 100 to reproduce the published numbers.
Images
Host software CLI (main.py)
Auto-detects the device by USB VID/PID and provides an interactive prompt. Pass a port
as the first argument to override the search (uv run main.py /dev/ttyACM1).
Command
Description
start
Start a test session (3s countdown). Logs to output/<timestamp>_session.csv.
stop
Stop the test and close the session CSV.
debug, d
Enable debug mode: device streams raw ADC readings and voltage.
interval <float>, i <float>
Set the time between measurements in seconds (default 0.5).
clicks <int>, c <int>
Set the number of measurements per session (default 10).
mode <click|move>, m <...>
Set the measurement mode (default click).
distance <1-32767>, x <int>
Move mode: distance in HID counts, sent as one atomic report (default 500).
direction <up|down|left|right>, r <...>
Move mode: direction (default right).
test, t
Move mode: Fire one visible move with the current settings, then move back after 1s.
connect / disconnect
Open / close the serial connection.
help
Show the command list.
exit, quit
Disconnect and quit.
Measurement modes
Click (default): each measurement is a left mouse click, e.g. a muzzle
flash in a game, or an app that toggles the screen color on click.
Move: each measurement is a single mouse movement, e.g. camera turns in
a game. After each measurement the firmware moves the cursor back to where it started.
Usage
main.py and analyze.py run on macOS, Linux and Windows.
Before starting a session, run an application on the PC under test in
which the mouse input causes a sufficiently large brightness change.
sh
uv sync                     # set up Python environment
uv run main.py              # connect to the device, then type: start
uv run main.py COM5         # might be needed in Windows if COM port auto-detect fails
uv run analyze.py output/<session>.csv
uv run analyze.py output/   # or pool a whole folder of sessions
By default, analyze.py automatically calibrates based on the given input files.
This test run was done with a proof-of-concept design of the PCB with less sensitivity. To replicate the results from the blog post exactly, use the analyzer with its historical threshold of 100, for example: uv run analyze.py test_run1/output/1_x11_ll-ON_vrr-ON -t 100.
It measures 30 × 48 mm and has 2 copper layers, 1.6 mm thick.
What parts does the Frameprobe use?
18 parts, built around the TLV9061IDBVR-MS, RP2040-ZERO and VBPW34S. The full list of its parts is on this page, with links to each part's symbol and footprint where PCBKit's library has them.
Where can I download the Frameprobe KiCad files?
From the frameprobe/frameprobe repository on GitHub, at the commit this page was made from: the board is hardware/pcb/frameprobe.kicad_pcb and its schematic hardware/pcb/frameprobe.kicad_sch. PCBKit opens the board in the browser, with nothing to install.
Can I use the Frameprobe design in my own project?
Its repository publishes it under the GPL-3.0 licence: you may reuse it on that licence's terms (keep the author's notice, and for a copyleft licence share your changes alike).
If running windows 11 or 10 with DPI scaling be sure to disable it as follows. 1) Right click properties on 3dplayer.exe in the 3DPlayer folder 2) Click on "Compatability" tab then click on the button at the bottom…
BLDC Motor Driver hardware and firmware project including power stage, gate driver, protection circuits, and control firmware for sensor-based and/or sensorless BLDC motors.